Fig. 2
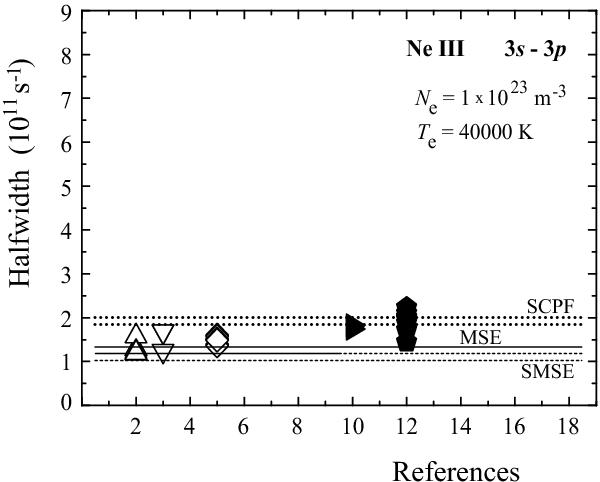
Experimental Ne III Stark halfwidth data for the 3s − 3p transition. References: 2 – Konjević and Pittman (1987), 3 – Purić et al. (1988), 5 – Uzelac et al. (1993), 10 – Blagojević et al. (2000) and 12 – Milosavljević et al. (2001). Dotted lines represent theoretical results of SCPF calculation (Dimitrijevic 2001), solid lines represent data calculated with the MSE formula (Dimitrijević & Konjević 1980) and dashed lines represent data calculated with the SMSE formula (Dimitrijević & Konjević 1987).
Current usage metrics show cumulative count of Article Views (full-text article views including HTML views, PDF and ePub downloads, according to the available data) and Abstracts Views on Vision4Press platform.
Data correspond to usage on the plateform after 2015. The current usage metrics is available 48-96 hours after online publication and is updated daily on week days.
Initial download of the metrics may take a while.