Fig. 9
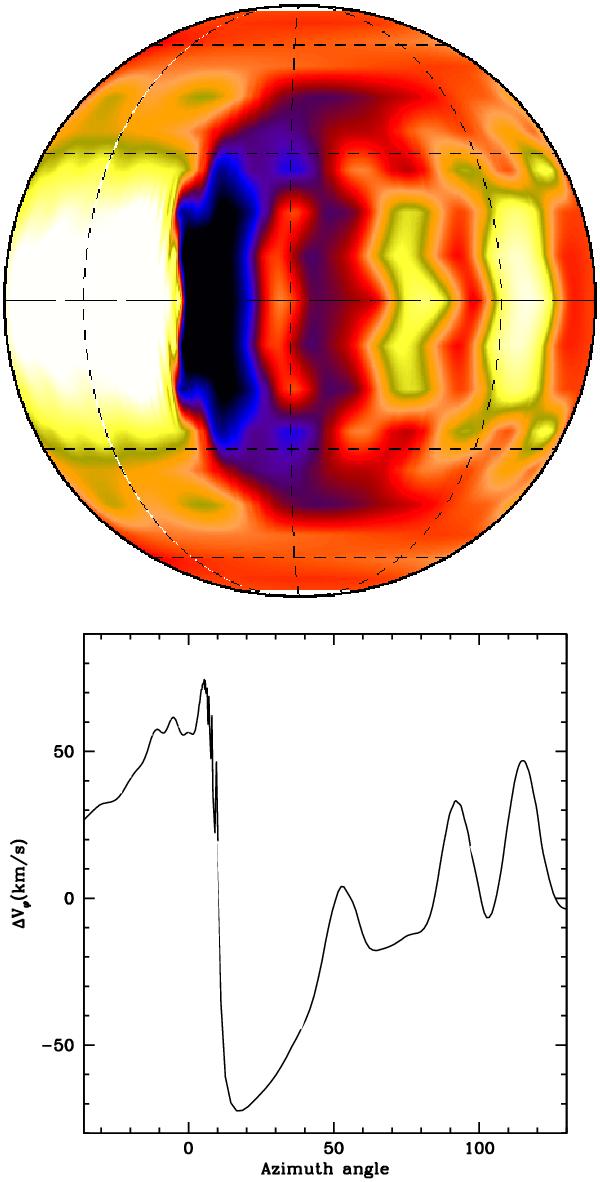
Map depicting the azimuthal (“horizontal”) velocity field at orbital phase φ = 0.2 for case65c. Velocities that are larger than the rigid-body rotation rate are coded in light color, while those that are slower are coded in dark. The “blue dip” in the theoretical RV curve is caused by the extended blue wing in the photospheric absorption lines, and this is produced by the large white area near the approaching (left) limb of the star. The bottom panel is a plot of the azimuthal velocity perturbations along the equatorial latitude.
Current usage metrics show cumulative count of Article Views (full-text article views including HTML views, PDF and ePub downloads, according to the available data) and Abstracts Views on Vision4Press platform.
Data correspond to usage on the plateform after 2015. The current usage metrics is available 48-96 hours after online publication and is updated daily on week days.
Initial download of the metrics may take a while.