Fig. 6
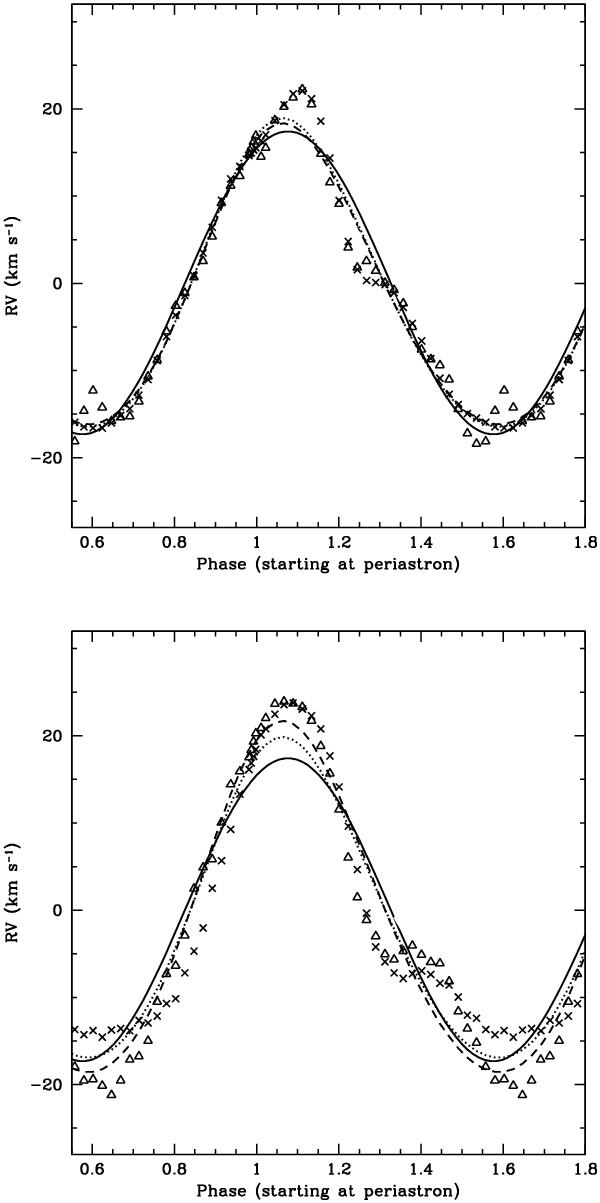
Radial velocities obtained from calculations with different layer depths for the “standard” rotation velocity (top; cases 61c,d) and the “slow” velocity (bottom; cases 61a,b). Also plotted are the corresponding best-fit Keplerian curves and the curve that describes the actual orbital motion (continuous curve). Crosses and the dotted curve correspond to dR/R1 = 0.06; and triangles and the dash curve correspond to dR/R1 = 0.10. The perturbations due to tidal flows are more significant for the “slow” rotation velocity cases.
Current usage metrics show cumulative count of Article Views (full-text article views including HTML views, PDF and ePub downloads, according to the available data) and Abstracts Views on Vision4Press platform.
Data correspond to usage on the plateform after 2015. The current usage metrics is available 48-96 hours after online publication and is updated daily on week days.
Initial download of the metrics may take a while.