Fig. 4
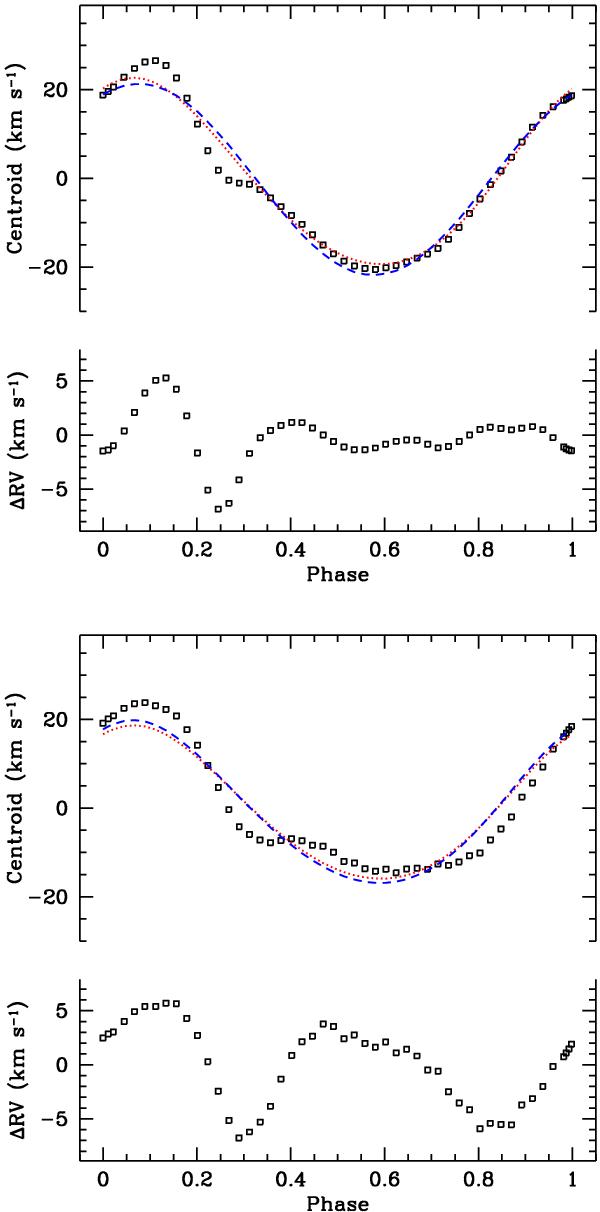
Radial velocity curves from the tidally perturbed line profiles (squares) compared to the actual projected orbital motion (dotted curve) and best-fit curve (dash curve). Δ RV is the difference between the perturbed and non-perturbed RV values. Top: mns = 1.830 M⊙, β0 = 0.614 (the “standard” case; case65c); Bottom: mns = 1.468 M⊙, β0 = 0.300 (case 61a).
Current usage metrics show cumulative count of Article Views (full-text article views including HTML views, PDF and ePub downloads, according to the available data) and Abstracts Views on Vision4Press platform.
Data correspond to usage on the plateform after 2015. The current usage metrics is available 48-96 hours after online publication and is updated daily on week days.
Initial download of the metrics may take a while.