Fig. 10
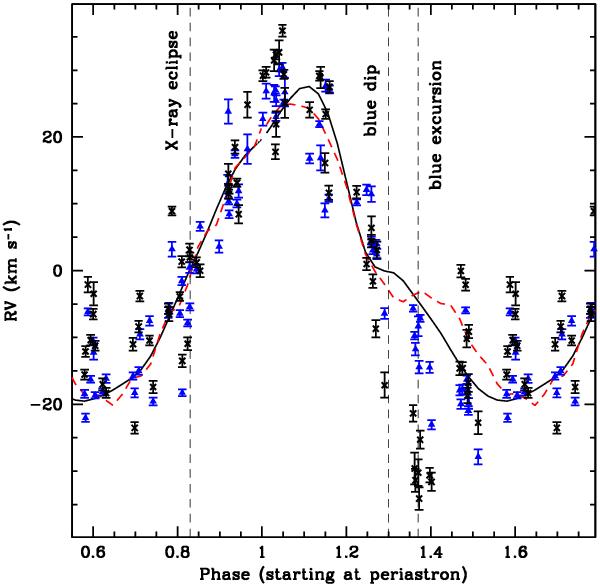
Theoretical RV curves for a neutron-star mass mns = 1.83 M⊙ for β0 = 0.614 (continuous curve; case 65c) and mns = 1.468 M⊙ for β0 = 0.300 (dash curve; case 61b). Data points are the RV measurements from Barziv et al. (2001): the average of several lines (triangles) and the values for Hδ (crosses). The vertical dash lines indicate the phase of X-ray eclipse, the approximate location of the blue “dip” in the RV curve and the “blue excursion”. The latter may be due to outflows from the B-supergiant. We suggest these outflows may be associated with activity induced by the tidal flows.
Current usage metrics show cumulative count of Article Views (full-text article views including HTML views, PDF and ePub downloads, according to the available data) and Abstracts Views on Vision4Press platform.
Data correspond to usage on the plateform after 2015. The current usage metrics is available 48-96 hours after online publication and is updated daily on week days.
Initial download of the metrics may take a while.