Fig. 1
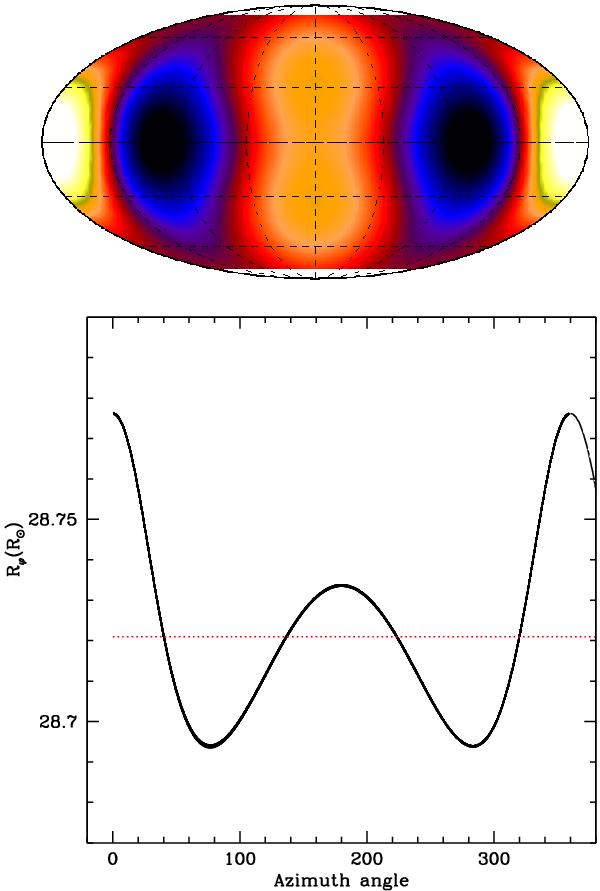
Top: shape of the stellar surface in the equilibrium configuration (case 065); black/white color coding corresponds to the minimum/maximum radius; the map is centered on 180° longitude. The asymmetry in the tidal bulges stems from the fact that the orbital separation is small compared to the radius of m1. Bottom: the radius as a function of longitude at the equator. All the 40 orbital phases for which it was computed are plotted, showing that no surface perturbations are present in this calculation.
Current usage metrics show cumulative count of Article Views (full-text article views including HTML views, PDF and ePub downloads, according to the available data) and Abstracts Views on Vision4Press platform.
Data correspond to usage on the plateform after 2015. The current usage metrics is available 48-96 hours after online publication and is updated daily on week days.
Initial download of the metrics may take a while.