Free Access
Fig. 3
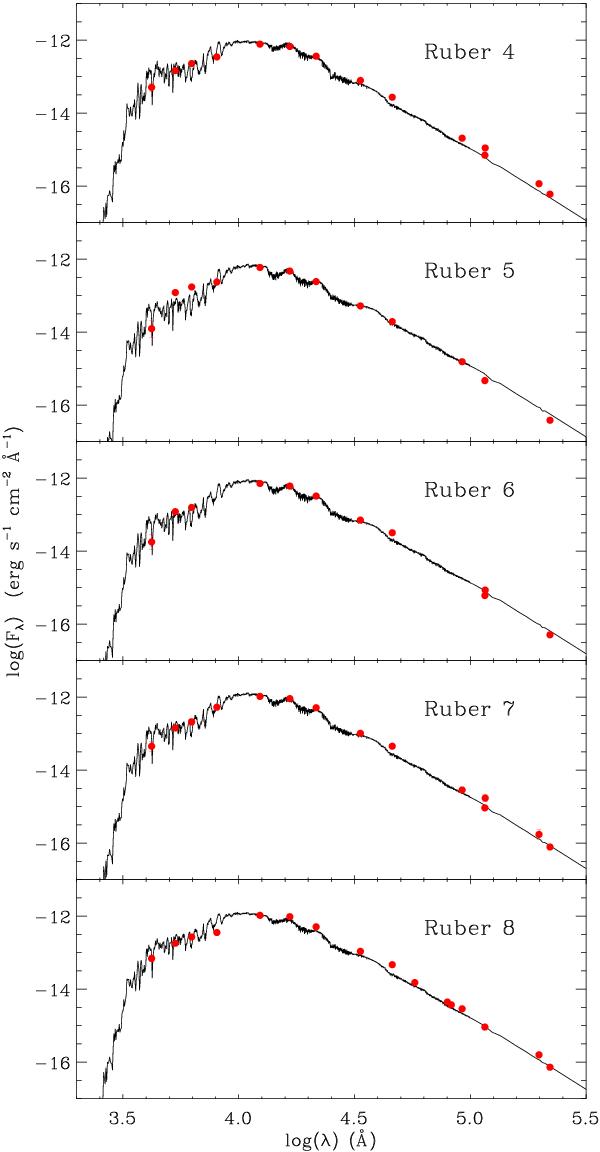
Theoretical SED fits of Ruber 4 to 8, from top to bottom. Solid lines represent the NextGen models for solar metallicity that best fit the observational data. Filled [red] circles indicate the observational photometric data used for the fit. Error bars are usually smaller than the size of the circles.
Current usage metrics show cumulative count of Article Views (full-text article views including HTML views, PDF and ePub downloads, according to the available data) and Abstracts Views on Vision4Press platform.
Data correspond to usage on the plateform after 2015. The current usage metrics is available 48-96 hours after online publication and is updated daily on week days.
Initial download of the metrics may take a while.