Fig. 7
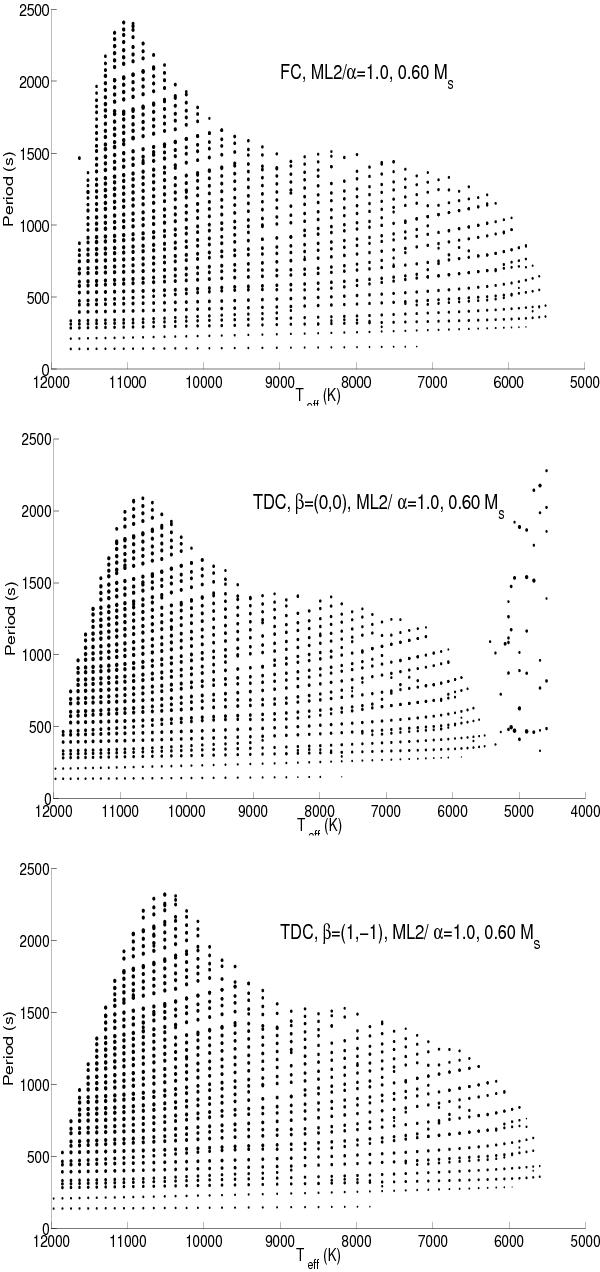
Periods (in seconds) of the excited l = 1 g-modes as functions of the effective temperature along the 0.6 M⊙ evolutionary sequence computed with the detailed atmosphere modeling. The size of a dot is a measure of the excitation of that particular mode. Top panel: FC. Middle panel: TDC with β = (0,0). Bottom panel: TDC with β = (1, −1).
Current usage metrics show cumulative count of Article Views (full-text article views including HTML views, PDF and ePub downloads, according to the available data) and Abstracts Views on Vision4Press platform.
Data correspond to usage on the plateform after 2015. The current usage metrics is available 48-96 hours after online publication and is updated daily on week days.
Initial download of the metrics may take a while.