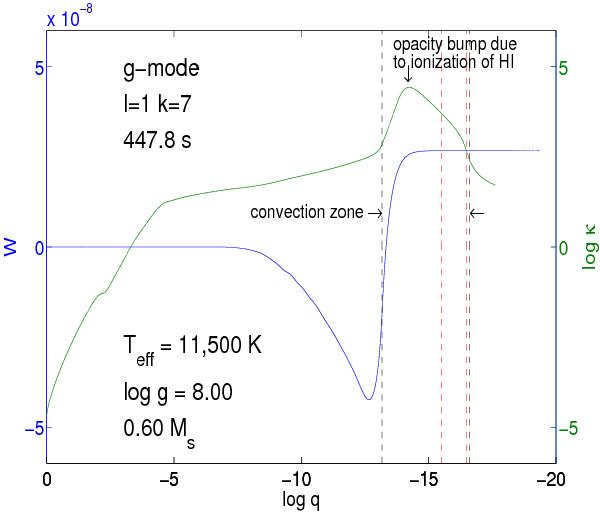
Fig. 4

Details of the driving/damping region for a typical unstable g-mode in a representative model of a ZZ Ceti star. The boundaries of the superficial convection zone are indicated by the two vertical dashed black lines. The vertical dashed red lines are, respectively, the position of the photosphere (Rosseland optical depth of 2/3) on the right, and of the base of the atmosphere (Rosseland optical depth of 100) on the left. The green curve (right ordinate axis) illustrates the profile of the Rosseland opacity, while the blue curve (left ordinate axis) shows the running (from left to right) work integral for the excited mode.
Current usage metrics show cumulative count of Article Views (full-text article views including HTML views, PDF and ePub downloads, according to the available data) and Abstracts Views on Vision4Press platform.
Data correspond to usage on the plateform after 2015. The current usage metrics is available 48-96 hours after online publication and is updated daily on week days.
Initial download of the metrics may take a while.


