Free Access
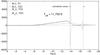
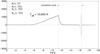
Fig. 10
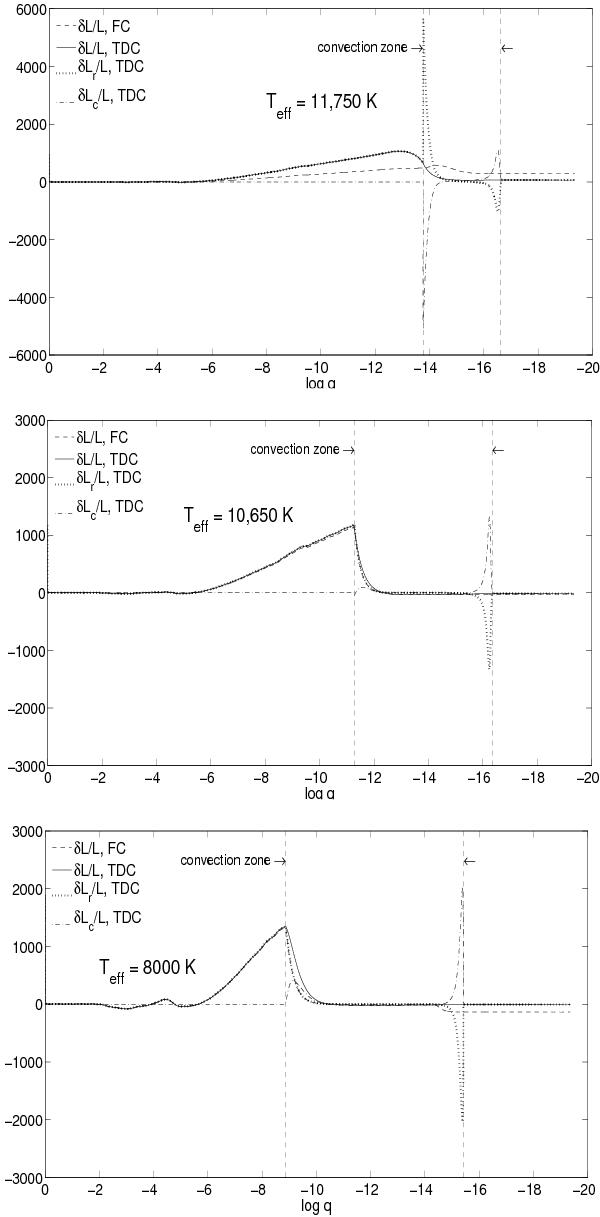
Total luminosity variation δL/L (solid curve: TDC treatment, dashed curve: FC approximation), with contributions of radiation (dotted curve) and convection (dot-dashed curve), along the evolutionary sequence. The limits of the convection zone are indicated in each panel by the vertical dashed lines.
This figure is made of several images, please see below:
Current usage metrics show cumulative count of Article Views (full-text article views including HTML views, PDF and ePub downloads, according to the available data) and Abstracts Views on Vision4Press platform.
Data correspond to usage on the plateform after 2015. The current usage metrics is available 48-96 hours after online publication and is updated daily on week days.
Initial download of the metrics may take a while.