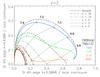
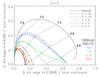
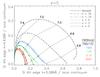
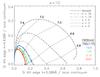
Fig. A.1
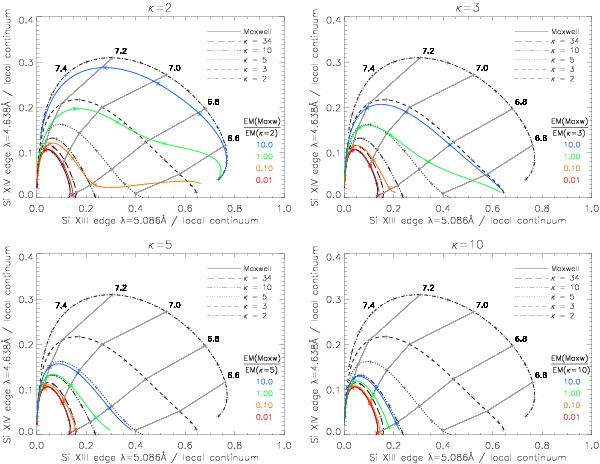
Determination of the apparent κ from the combination of a Maxwellian plasma and a plasma with a κ-distribution with known κ. The known κ is labeled in the title of each image in the panel. Black lines and their respective coding are the same as in Fig. 7. Colored lines denote the dependence of the relative height of the ionization edges on the emission measure ratio EM(Maxw)/EM(κ) = 10-2 (red), 10-1 (orange), 1 (green) and 10 (blue). Asterisks denote the points corresponding to log(T/K) = 6.8, 7.0, and 7.2. Except for the top left panel for κ = 2, these points are always close to the respective isotherms (gray lines).
Current usage metrics show cumulative count of Article Views (full-text article views including HTML views, PDF and ePub downloads, according to the available data) and Abstracts Views on Vision4Press platform.
Data correspond to usage on the plateform after 2015. The current usage metrics is available 48-96 hours after online publication and is updated daily on week days.
Initial download of the metrics may take a while.