Fig. 7
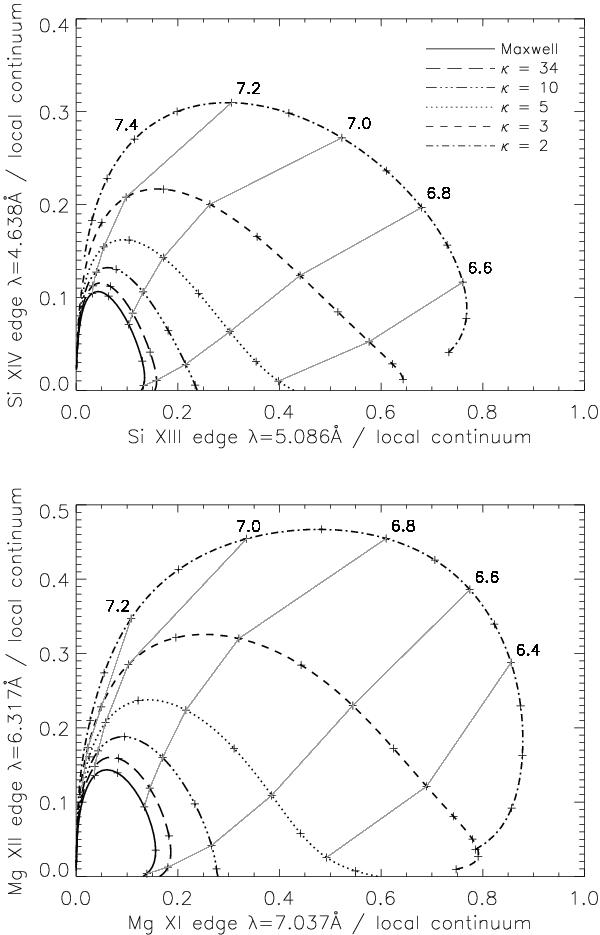
Theoretical diagnostics plots for the κ-distributions from the ionization edges of Si and Mg. Top: ratios of the Si xiii and Si xiv edges to the total continuum at the wavelength of the edge. Bottom: the same as in top, but for Mg xi and Mg xii. The thin gray lines are isotherms connecting the points of constant log(T/K) for different κ.
Current usage metrics show cumulative count of Article Views (full-text article views including HTML views, PDF and ePub downloads, according to the available data) and Abstracts Views on Vision4Press platform.
Data correspond to usage on the plateform after 2015. The current usage metrics is available 48-96 hours after online publication and is updated daily on week days.
Initial download of the metrics may take a while.