Fig. 9
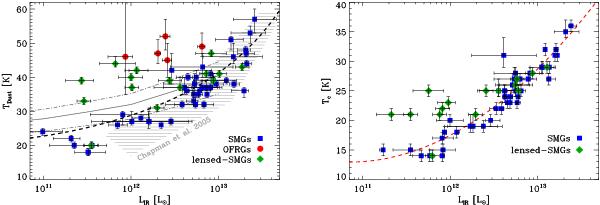
(Left) Dust temperature-luminosity relation inferred from our single temperature model. The symbols are same as in Fig. 6. Red circles present the OFRG sample of Magnelli et al. (2010). The striped area presents results for SMGs extrapolated by Chapman et al. (2005) from radio and submm data. The Chapman et al. (2003) derivation of the median and interquartile range of the Tdust − LIR relation observed at zs0 is shown by solid and dashed-dotted lines, linearly extrapolated to 1013 L⊙. The dashed line represent the dust temperature-luminosity relation derived in Roseboom et al. (2011) for mm-selected sample observed with SPIRE and assuming a single modified blackbody model. (Right) Dust temperature-luminosity relation inferred from our power-law temperature distribution model. Symbols are the same as in the left panel. The red dashed line presents the Tc − LIR relation inferred from a least-square second degree polynomial fit.
Current usage metrics show cumulative count of Article Views (full-text article views including HTML views, PDF and ePub downloads, according to the available data) and Abstracts Views on Vision4Press platform.
Data correspond to usage on the plateform after 2015. The current usage metrics is available 48-96 hours after online publication and is updated daily on week days.
Initial download of the metrics may take a while.