Fig. 8
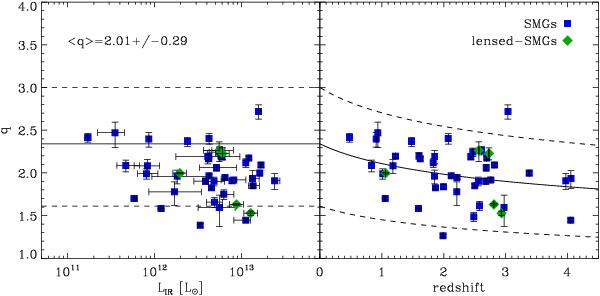
Evolution of ⟨ q ⟩ as function of the infrared luminosity (left panel) and the redshift (right panel). On the left panel, solid and dashed lines show the local relation and its 1σ dispersion as found by Yun et al. (2001). On the right panel, solid and dashed lines show the redshift evolution of ⟨ q ⟩ ∝ (1 + z) − 0.15 ± 0.03 from its local value as inferred in Ivison et al. (2010a). The symbols are same as in Fig. 6. Note that here, we did not attempt to correct for any incompleteness, e.g., using a Kaplan-Meier estimator, and biases introduced in our sample. So these results should be taken with caution because they only apply to our specific selection function, i.e., SMG with spectroscopic redshift estimates mainly obtained through robust radio identifications.
Current usage metrics show cumulative count of Article Views (full-text article views including HTML views, PDF and ePub downloads, according to the available data) and Abstracts Views on Vision4Press platform.
Data correspond to usage on the plateform after 2015. The current usage metrics is available 48-96 hours after online publication and is updated daily on week days.
Initial download of the metrics may take a while.