Fig. 7
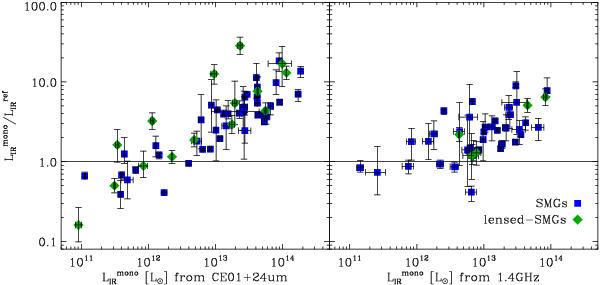
Infrared luminosities for submm sources detected at 24 μm and 1.4 GHz. The x-axis shows the infrared luminosities extrapolated from the MIPS-24 μm (left) or the radio (right) flux density, using the CE01 library or the FIR/radio correlation (with q = 2.34), respectively. The y-axis shows the ratio of the infrared luminosities extrapolated from the MIPS-24 μm or radio flux density and the reference infrared luminosities inferred from our power-law temperature distribution model. The symbols are same as in Fig. 6.
Current usage metrics show cumulative count of Article Views (full-text article views including HTML views, PDF and ePub downloads, according to the available data) and Abstracts Views on Vision4Press platform.
Data correspond to usage on the plateform after 2015. The current usage metrics is available 48-96 hours after online publication and is updated daily on week days.
Initial download of the metrics may take a while.