Fig. 6
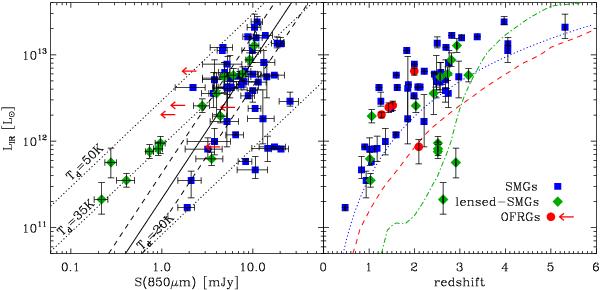
(Left) Infrared luminosities as function of the submm flux density. Blue squares represent SMGs situated in blank fields while green diamonds represent lensed-SMGs. OFRGs from Magnelli et al. (2010) are presented with left red arrows. The solid and dashed lines show the linear fit to the LIR − S850 relation and the 1σ envelope ( [mJy]). Dotted lines show the LIR − S850 relation followed by single modified (β = 1.5) blackbody functions at 20, 35 and 50 K. (Right) Infrared luminosities as function of the redshift. The symbols are same as in the left panel but OFRGs are represented by red filled circles. Blue dotted, red dashed and green dotted-dashed lines present the lower limit of the parameter space reachable using our deep radio (i.e., 20 μJy), PACS 160 μm (i.e., 3 mJy) and MIPS-24 μm (i.e., 20 μJy) observations of the GOODS-N field, respectively. Note that in these figures galaxies with high χ2 value do not lie in a particular region of these plots but are rather randomly distributed.
Current usage metrics show cumulative count of Article Views (full-text article views including HTML views, PDF and ePub downloads, according to the available data) and Abstracts Views on Vision4Press platform.
Data correspond to usage on the plateform after 2015. The current usage metrics is available 48-96 hours after online publication and is updated daily on week days.
Initial download of the metrics may take a while.