Fig. 5
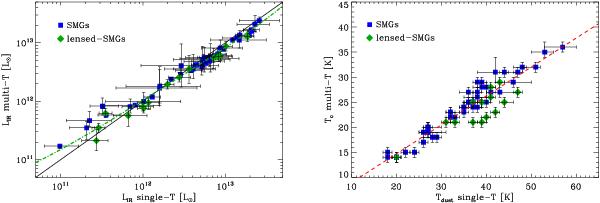
(Left) Comparison of the infrared luminosities inferred using a power-law temperature distribution model with those inferred using a single dust temperature model. Symbols are the same as in Fig. 2. The black solid line shows the one-to-one relation. The green dotted-dashed line shows the bias introduced in our single dust temperature model by the use of a constant bolometric-correction term of 1.91 to convert LIR [40−120 μm] into LIR [8−1000 μm] . To compute this line we measure LIR [40−120 μm] and LIR [8−1000 μm] on a power-law temperature template library normalized to reproduce the Tc − LIR correlation (see the red dashed line in the right panel of Fig. 9). We then plot on the x-axis 1.91 × LIR [40−120 μm] and on the y-axis LIR [8−1000 μm] . (Right) Comparison of the dust temperatures inferred using a power-law temperature distribution model (Tc) with those inferred using a single dust temperature model (Tdust). The red dashed line show a linear fit to the Tc–Tdust relation, Tc = 0.6 × Tdust + 3 K. Symbols are the same as in the left panel. Note that Tc indicates the temperature of the coldest dust component of the multi-component model while Tdust measures an effective dust temperature.
Current usage metrics show cumulative count of Article Views (full-text article views including HTML views, PDF and ePub downloads, according to the available data) and Abstracts Views on Vision4Press platform.
Data correspond to usage on the plateform after 2015. The current usage metrics is available 48-96 hours after online publication and is updated daily on week days.
Initial download of the metrics may take a while.