Fig. 11
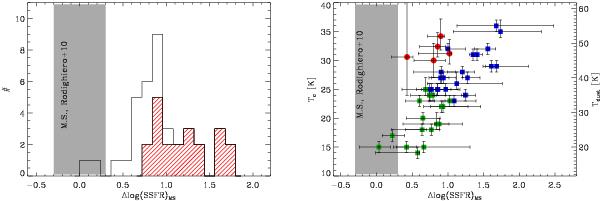
(Left) Distribution of “distance” with respect to the main sequence observed in our SMG sample having accurate stellar masses estimates (empty histogram). The hatched histogram shows the distribution observed in a subsample of luminous SMGs with SFR > SFR , i.e.,
  at 0 < z < 2 and LIR ≳ 1012.7 L⊙ at z > 2. (Right) Dust temperature of SMGs as function of their distance with respect to the main sequence of star-formation. Blue squares show luminous SMGs with at 0 < z < 2 and LIR ≳ 1012.7 L⊙ at z > 2. Green squares show SMGs with infrared luminosities below these thresholds. Red points represent the OFRGs, i.e., galaxies with relatively low infrared luminosities below our treshold. In both plots the location of the main sequence as function of the redshift is taken from Rodighiero et al. (2010). The 1σ scatter around this main sequence is illustrated by the shaded area.
Current usage metrics show cumulative count of Article Views (full-text article views including HTML views, PDF and ePub downloads, according to the available data) and Abstracts Views on Vision4Press platform.
Data correspond to usage on the plateform after 2015. The current usage metrics is available 48-96 hours after online publication and is updated daily on week days.
Initial download of the metrics may take a while.