Fig. 10
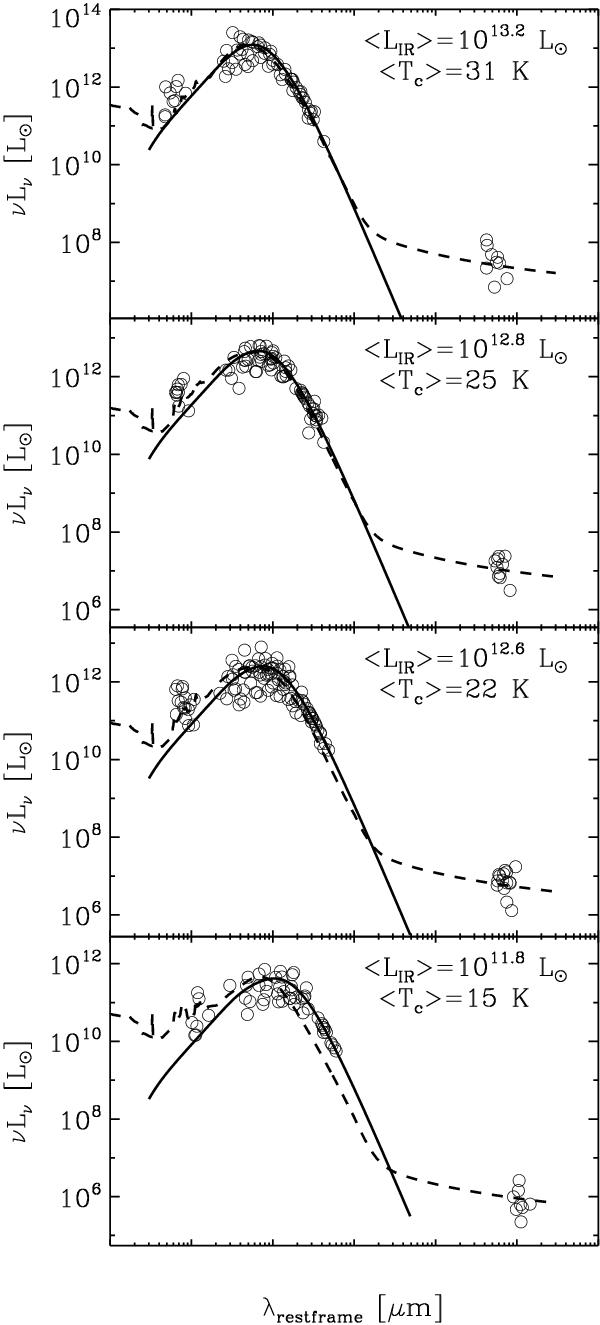
Mean rest-frame SED of SMGs for four infrared luminosity bins, from bottom to top: LIR < 1012 L⊙; 1012 L⊙ < LIR < 1012.7 L⊙; 1012.7 L⊙ < LIR < 1013 L⊙ and 1013 L⊙ < LIR. The solid lines show the power-law temperature distribution SED corresponding to the mean dust mass and dust temperature of the bin. The photometry of each of the sources was slightly renormalized to match these SED templates at submm wavelengths. Dashed lines represent the CE01 template corresponding to the mean infrared luminosity of the bin, i.e., these templates were not fitted to the photometry of our SMGs.
Current usage metrics show cumulative count of Article Views (full-text article views including HTML views, PDF and ePub downloads, according to the available data) and Abstracts Views on Vision4Press platform.
Data correspond to usage on the plateform after 2015. The current usage metrics is available 48-96 hours after online publication and is updated daily on week days.
Initial download of the metrics may take a while.