Fig. 1
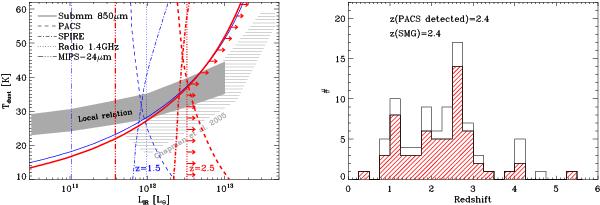
(Left) Selection limits introduced in the Tdust − LIR parameter space by single-wavelength detection techniques. Continuous, dashed, dotted-dashed, triple-dotted-dashed and dotted lines show the lower limits on LIR introduced by the submm, PACS, SPIRE, MIPS-24 μm and radio observations, respectively, at z = 1.5 (thin blue lines) and at z = 2.5 (thick red lines). The parameter space reachable by a given single-wavelength detection technique corresponds to the area situated to the right of the lines. As an example, the red arrows show the parameter space probed at zs2.5 by our GOODS-N SMG sample. The shaded area shows the local Tdust − LIR relation found by Chapman et al. (2003), linearly extrapolated to 1013 L⊙. The striped area presents results for SMGs extrapolated by Chapman et al. (2005) from radio and submm data. (Right) The hatched histogram shows the redshift distribution of our PACS/SPIRE detected SMG sample. The empty histogram shows the redshift distribution of its parent sample, i.e., SMGs with robust redshift estimates obtained through secure multi-wavelength identifications.
Current usage metrics show cumulative count of Article Views (full-text article views including HTML views, PDF and ePub downloads, according to the available data) and Abstracts Views on Vision4Press platform.
Data correspond to usage on the plateform after 2015. The current usage metrics is available 48-96 hours after online publication and is updated daily on week days.
Initial download of the metrics may take a while.