| Issue |
A&A
Volume 539, March 2012
|
|
|---|---|---|
| Article Number | A36 | |
| Number of page(s) | 11 | |
| Section | Planets and planetary systems | |
| DOI | https://doi.org/10.1051/0004-6361/201118302 | |
| Published online | 22 February 2012 | |
Physical and dynamical characterisation of the unbound asteroid pair 7343-154634
1 Centre for Astrophysics and Planetary Science, University of Kent, Canterbury, Kent, CT2 7NH, UK
e-mail: This email address is being protected from spambots. You need JavaScript enabled to view it.
2 Planetary and Space Sciences, Department of Physical Sciences, The Open University, Walton Hall, Milton Keynes, MK7 6AA, UK
3 Planetary Science Section, Jet Propulsion Laboratory, Pasadena, CA 91109, USA
4 Armagh Observatory, College Hill, Armagh, BT61 9DG, UK
Received: 20 October 2011
Accepted: 28 December 2011
Abstract
Context. Models have shown that asteroids can undergo fission if their rate of rotation is steadily increased. The forces acting to pull the asteroid apart exceed the material strength and gravitational force holding the asteroid together and material can escape from the surface of the asteroid. Initially forming a binary asteroid system, the components are capable of decoupling at low relative velocity from their mutual orbit if their mass ratio is less than 0.2. A number of asteroids with very similar orbital elements have been shown to have had very recent (<1 Myr) encounters at distances smaller than the Hill sphere radius of the larger of the asteroids. The mass ratio of the asteroids in each pair is estimated to be less than 0.2, suggesting that these unbound pairs are the result of rotational fission.
Aims. We determine whether the asteroids in one such unbound pair, (7343) Ockeghem and (154 634) 2003 XX28, share a common composition, indicative of asteroids formed from a common parent and further constrain a likely formation age for this pair.
Methods. We have obtained spectroscopic observations of each asteroid covering the wavelength range 0.45 to 1.0 microns. Using thermal observations we have measured the size and albedo of (7343) Ockeghem. Combined with optical lightcurve data of both asteroids, we have constrained the size and density of the asteroids and estimated the strength of the Yarkovsky force experienced by both. This improved physical information has been used in new dynamical simulations of the asteroids’ orbits to better constrain a formation time of this pair.
Results. We find that the asteroids have very similar spectra consistent with an S-type taxonomy. The geometric albedo of (7343) Ockeghem, 0.20 ± 0.06 is consistent with this classification. The mass ratio range of the asteroids assuming an equal density, 0.007 to 0.065, is consistent with models of unbound asteroid pair formation. A new dynamical analysis has indicated that an absolute lower limit for the age of this pair is 400 kyr with a more likely age around 560 kyr, lower than a previous estimate of 800 kyr.
Key words: minor planets, asteroids: general
© ESO, 2012
1. Introduction
The Yarkovsky-OKeefe-Paddack-Radziewski effect (hereafter, YORP) changes the rotation state of an asteroid. The simple action of sunlight reflecting off the asteroid surface, coupled with the anisotropic emission of thermal radiation can induce a torque on the body that is capable of changing the rotation rate and obliquity (Rubincam 2000). The effect of YORP-induced spin-up has recently been detected and measured for asteroids (54 509) YORP, (1862) Apollo and (1620) Geographos (Lowry et al. 2007; Taylor et al. 2007; Kaasalainen et al. 2007; Ďurech et al. 2008).
Asteroids with diameters larger than several hundred metres are believed to be large assemblages, i.e. rubble piles, held together by their own self-gravity with very little internal strength (Pravec & Harris 2000). Simulations by Walsh et al. (2008) examined the effect of increasing the spin-rate of an N-body model with no cohesive strength. It was demonstrated that as these bodies approach their spin limit, they can experience shape changes, with spherical and ellipsoidal bodies becoming more oblate. The models also indicated that mass could be transferred from the object’s poles to the equator, where it could then be spun off the surface. Under the right conditions the mass shed from the asteroid surface could coalesce in orbit, creating a binary asteroid system. Therefore, YORP-induced spin-up of asteroids is a highly plausible formation mechanism for binary asteroid systems observed in the main asteroid belt.
The initial formation and evolution of a binary system through YORP-induced spin-up and fission is a complex process due to the exchange of energy and angular momentum between the two bodies. While Walsh et al. (2008) showed that satellite formation from material shed from an asteroid surface due to rotational spin-up was possible, their models did not follow the subsequent evolution of the binary systems. Scheeres (2007) examined the case of a contact binary asteroid consisting of a sphere and ellipsoid resting on each other experiencing a rotational torque. In this case it was shown that there are three potential outcomes for the system:
-
a stable binary system;
-
impact of the secondary upon the primary;
-
decoupling from the mutual orbit.
The outcome is highly dependent upon the initial free energy of the system. The free energy is a function of the kinetic and potential energies of each component of the system. If the initial free energy is negative, then the system either undergoes impact of the secondary upon the primary, or the system stabilises. However, if the free energy is positive, the primary and secondary can decouple from their mutual orbit, resulting in two independent bodies in orbit about the Sun. Models suggest that the separation of the components typically occurs at low relative velocity, on the order of several metres per second. The free energy of the system is dependent on the mass ratio of the components. For decoupling to occur, the mass of the secondary needs to remain below 20% of the mass of the primary (Scheeres 2009). Jacobson & Scheeres (2011) investigate the mechanisms and timescales involved in causing the fission of a contact binary asteroid undergoing YORP-induced spin-up. Decoupling after the formation of a binary is extremely common (more than 95% of systems with a mass ratio <0.2 disrupted in their simulations) and very rapid, occurring on timescales on the order of only 1 year.
Previously-known physical properties of unbound asteroid pair 7343-154 634.
Vokrouhlický & Nesvorný (2008) have recently analysed the orbits of 60 asteroid pairs with very similar orbital elements. Backward integration of the orbits of the asteroids in each pair suggests that they have had a close encounter within the last 1 Myr. They attribute these encounters to the formation of the pairs from a common origin, perhaps through collisional disruption or YORP-induced rotational fission of a common parent asteroid or the decoupling of unstable asteroid binaries. For example, dynamical analysis indicates that the pair (6070) Rhineland – (54 827) 2001 NQ8 had a close (250 km) encounter only ≈ 17 kyr ago (e.g. Vokrouhlický & Nesvorný 2008; Vokrouhlický & Nesvorný 2009; Vokrouhlický et al. 2011). This separation distance is well within the estimated Hill sphere radius of (6070) Rhineland, while the relative velocity at closest approach, 0.25 m s-1, makes this pair an excellent candidate for formation from YORP-induced rotational fission and subsequent decoupling.
Pravec et al. (2010) presented a detailed analysis of a subset of this list. Lightcurves and rotational periods were presented for the majority of the larger primary asteroids in each pair. The absolute magnitudes of the asteroids were used to determine an estimate for the mass ratio of the asteroids in each pair. It was found that the estimated mass ratios were below the prerequisite value of 0.2 for the secondary in each pair to have positive free energy and thus be capable of decoupling from the primary. They demonstrated that the rotation periods and mass ratios fell within a narrow range predicted by their model of binary asteroid decoupling, which along with the recent close orbital encounters of the asteroids in each pair was stated to be evidence of rotational fission.
However, the mass ratios in that study were determined by using the absolute magnitudes published in the AstDys catalogue. Unfortunately, the values quoted in this catalogue are in many cases unreliable. Comparison of the AstDys1 catalogue to the JPL Small Body Browser2 shows that in some cases the absolute magnitudes listed on each site are significantly different. The absolute magnitudes in many cases are based on astrometric magnitudes at the time of discovery and may not accurately reflect the actual absolute magnitude of the asteroids. Measuring the absolute magnitude of each asteroid would therefore produce a more accurate mass ratio.
Secondly, the Yarkovsky force used for each asteroid in the dynamical simulations were estimated based on size and heliocentric distance. By obtaining thermal observations of the asteroids, a more accurate size, albedo and thus mass ratio of the asteroids could be established. This would also lead to a more accurate estimate of the Yarkovsky force experienced by the asteroids and thus a more reliable integration of the asteroid orbits. This may further constrain or significantly modify the formation age of these asteroids. This could be improved further by having an accurate spin state model for the asteroids since the direction of Yarkovsky drift would then be known.
Finally, and probably most importantly, although the orbital integrations indicate a recent close encounter, there is the possibility that this is just a serendipitous event. To determine with high probability whether the asteroids in each pair have a common origin, comparison of the spectra of each component will indicate whether the asteroids have a common mineralogy, expected if they originate from a common parent. A measurement of the asteroid albedos would also provide information regarding the asteroid compositional similarity or difference.
We present a physical and dynamical analysis of the asteroids (7343) Ockeghem and (154 634) 2003 XX28, hereafter 7343 and 154 634, which are thought to be one example of an unbound asteroid pair formed through rotational fission followed by decoupling. Pravec et al. (2010) provide an age estimate of >800 kyr for this pair and an assumed (given the catalog absolute magnitudes) mass ratio of 0.018. Known or estimated physical properties are given in Table 1. The current work aims to improve our knowledge of the physical properties of the asteroids in this proposed unbound pair and to determine whether or not the asteroids do have a common parentage. In Sect. 2 we present optical observations of the asteroids. In Sect. 3 we describe the thermal observations and subsequent modelling. We describe the dynamical simulations in Sect. 4.
2. Optical observations: data reduction and analysis
We conducted optical spectroscopy of both targets using the 3.6 m New Technology Telescope (NTT) at La Silla, Chile. To constrain their absolute magnitudes more accurately, we also obtained R-band photometry of both asteroids. Asteroid 7343 was observed using the 3.6 m NTT whilst 154 634 was observed using the 200-inch Hale Telescope at the Palomar Observatory. The observing geometries are listed in Table 2.
Observational geometry.
2.1. Optical spectroscopy
The ESO Faint Object Spectrograph and Camera2 (EFOSC2) was used to obtain spectroscopic observations of both targets. EFOSC2 consists of a Loral/Lesser, thinned, AR coated, UV flooded MPP 2048 × 2048 CCD. Observations were conducted using a 2 arcsec slit and Grism #1 while 2 × 2 binning on the CCD was employed, providing wavelength coverage from 0.4 to 1.0 microns with a dispersion of approximately 13 Angstroms per pixel. The slit was oriented at the parallactic angle to reduce atmospheric differential refraction effects. Observations were split into 3 or 4 exposures to reduce the impact of cosmic rays on the spectra. In total we observed 7343 for 1200 s and 154 634 for 3600 s.
A solar-analog star was observed to obtain the relative reflectance of the asteroid surface. The solar-analog SA 98-978 was observed for both asteroids to ensure that the entire reduction process was kept as consistent as possible, thus eliminating the addition of erroneous spectral features from using different solar analogs. The solar-analog star was observed at airmasses closely bracketing the airmass of the asteroid observation and in both cases the resulting average airmass match was exact. For wavelength calibration, He-Ar arc lamp spectra were obtained after each observation at the same telescope orientation and position.
A bias image was created from a median combination of several bias images obtained at the start of each night. This was then subtracted from the raw science images. The flatfield structure was removed during the removal of the solar spectrum (Bus et al. 2002). All spectra were extracted using the apall task available in IRAF. Optimal extraction of the spectra was used to increase signal-to-noise ratio (S/N) of the extracted spectra (Horne 1986). Bad pixels caused by cosmic ray events were cleaned during the extraction phase. After extraction, the spectra were wavelength-calibrated using a dispersion model derived from the observed arc-lamp spectra. The wavelength-calibrated asteroid spectra were then co-added and normalised at 0.55 μm and the normalised solar spectrum removed.
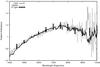 |
Fig. 1 Comparison of spectra of 7343-154634. The spectra are remarkably similar. The S-type reflectances are overplotted to indicate the quality of the fit. |
Figure 1 shows that the spectra of both asteroids are remarkably similar. In both spectra, reflectance increases with wavelength up to approximately 0.75 microns before decreasing beyond 0.75 microns. This decrease in reflectance appears to be consistent with absorption due to olivine and/or pyroxene centred around 1.0 micron. This is indicative of objects belonging to the large silicate-dominated S-complex. The semi-major axis of the asteroids, 2.13 AU, places them within the inner asteroid belt which is expected to be dominated by S-type objects (Mothé-Diniz et al. 2003).
The spectra were compared to the taxonomic types defined by the Bus-DeMeo taxonomy (DeMeo et al. 2009). The spectra were resampled to produce fluxes at the wavelengths used to define the various taxonomic types. Chi-square fitting was used to determine which taxonomic class each spectrum represented. For both asteroids, it was found that the most likely match was to that of an S-type asteroid, consistent with our initial visual inspection.
There is a large variation in the spectra which belong to each taxonomic type defined in the Bus-DeMeo taxonomy. Therefore, finding that the asteroids share a common taxonomy is not conclusive evidence that they share a common mineralogy. Direct comparison is required to robustly state that they represent the same composition. The resampled spectra of each asteroid were thus compared using a chi-square test to directly determine how similar they are. Resampling the spectra increased the S/N of the spectra and also reduced the effects of decreasing S/N at the red end of the spectra. We find at the 90% confidence limit there is no reason to reject the hypothesis that these spectra are identical, and that the asteroids therefore share a very similar composition and mineralogy.
As described in Sect. 2.2, R-band imaging of 7343 was conducted to accurately constrain the absolute magnitude of the asteroid. However, normal convention is to provide the V-band absolute magnitude. To determine the V − R colour of the asteroid, the IRAF task sbands was used. The filter response of the Bessel V and R filters were convolved with the reflectance spectrum of the asteroid, and the resultant flux summed and converted to magnitudes. Since the solar spectrum was removed during the reduction process, the solar V − R colour of 0.36 (Allen 1973) was used to convert the measured colour to that of a relative solar colour. The measured colour was 0.484 ± 0.009. This value closely matches the mean V − R colour for S-types (e.g., Shevchenko & Lupishko 1998).
2.2. Lightcurve observations
Broadband imaging of 7343 was conducted using EFOSC2 on the NTT. On-chip 2 × 2 binning was employed producing a pixel scale of 0.24 arcsec per pixel and a field of view of approximately 4 × 4 arcmin. The Bessel R-band filter was used throughout. Differential tracking was used to maximise the S/N of the asteroid, however the exposure times were short enough that the trailing of the background stars was maintained within the seeing disc.
Data were first bias-subtracted and then flatfielded. Fringing due to the strong emission of night sky lines was evident requiring the need for a fringemap correction. The reduced images were then shifted and aligned to produce a set of images in which the stars appeared stationary in the field of view. These images were then shifted according to the rates of motion of the asteroid obtained using the JPL HORIZONS ephemeris software. This produced a further set of images in which the asteroid appeared stationary in each image. The images in each image set were then co-added to improve the S/N of the measured asteroid brightness. Aperture photometry was used to measure the brightness of the stars and asteroid in each co-added image. The full width at half maximum (FWHM) was measured using several background stars and this was used to set the radius of the photometry apertures. Aperture radii used covered the range 2.2 to 2.6 arcsec. A weighted average of the comparison stars was used to extract the relative lightcurve segment of asteroid 7343 shown in Fig. 2. The lightcurve fragment suggests a period in the range 3.5–4.0 h, consistent with the period of 3.75 h measured by Pravec et al. (2010).
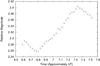 |
Fig. 2 Lightcurve Segment of asteroid (7343) Ockeghem. This segment is approximately one hour in length and is consistent with a rotation period between 3.5 and 4 h. |
The observations of 7343 were conducted in photometric conditions. The extinction due to airmass was measured directly using the comparison stars and standard star observations were used to determine the instrumental zero-point. A large aperture (6.9 arcsec) was used in the photometry to determine the apparent magnitude of asteroid 7343. Background sky contribution was negligible and so aperture corrections were not required. The apparent magnitude at the lightcurve midpoint was determined to be R = 16.477 ± 0.007. Using the colour derived from the reflectance spectra and the observing geometry of the observations, we measure an absolute magnitude of HV = 14.30 ± 0.08 for asteroid 7343. A G-value (Bowell et al. 1989) of 0.24 ± 0.11 was used, typical for S-type asteroids (Warner et al. 2009). The large uncertainty in the absolute magnitude is dominated by the uncertainty in the G-value used. However, this is significantly different to the HV listed on the AstDys database.
Broadband imaging of 154 634 was conducted over two nights using the Large Format Camera (LFC) mounted on the Palomar 200 inch Hale Telescope (Table 2). The LFC consists of a mosaic of six 2048 × 4096 SITe SI-002 thinned, backside illuminated, AR coated CCDs. Observations were conducted using 2 × 2 on-chip binning providing a pixel scale of 0.36 arcsec per pixel and a field of view of 6 × 12 arcmin on CCD 0. The Bessel R-band filter centred at 0.63 microns was used with typical exposure times of 300 s. Differential tracking was used to maximise the S/N of the asteroid in each exposure. This led to significant trailing of the background comparison stars.
The method used to reduce the Palomar data was identical to that employed for the NTT with the exception that a fringemap correction was not applied to the Palomar data. Images were combined in pairs in the manner previously described to produce images with a total exposure time of 600 s. Aperture photometry was then used to measure the brightness of the asteroid in each co-added image. The FWHM of the point spread function (PSF) of the asteroid was used to determine the aperture radius, with an aperture radii range of 1.1 to 1.5 arcsec being used. Photometry of several field stars was achieved using rectangular apertures defined according to the tracking rate of the telescope, the exposure time and the FWHM of the asteroid seeing profile. A weighted average of the comparison stars was used to extract the relative lightcurve of the target on both nights. A least-squares fourier fit of the lightcurve data was performed to determine an estimate of the period. It was found that the period solution P = 2.950 ± 0.015 h fits the data best. However, we note that part of the rotation phase is not adequately covered. The folded lightcurve is shown in Fig. 3.
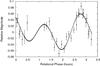 |
Fig. 3 Folded lightcurve of asteroid (154 634) 2003. XX38. The folded lightcurve period is 2.950 ± 0.015 h. |
VISIR filter characteristics.
The observations of 154 634 were conducted in non-photometric conditions. Calibration was performed by observing the target field during July 2011 using the NTT+EFOSC2 during photometric conditions. Standard stars were observed and used to determine the zero point and extinction due to airmass. Stars in the target field were then calibrated using these values. A simple scaling was then applied to the observations of 154 634 to determine the apparent magnitude of the asteroid. The apparent magnitude at the lightcurve midpoint was measured to be V = 21.580 ± 0.053 which, given the observing geometry, results in an absolute magnitude of HV = 17.19 ± 0.16. This value is again significantly different to the value listed on the AstDys database at the time of publication.
We can estimate the lower limit of the density of both objects from the lightcurve data using 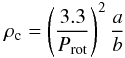 (1)
(1) (2)
(2)
where we assume that the asteroids are ellipsoids and  is the ratio of the major axis lengths in the asteroid defined by Eq. (2), Prot is the rotation period and Δm is the lightcurve amplitude (e.g. Luu & Jewitt 1992). Using the lightcurve data presented by (Pravec et al. 2010) and herein, we find that 7343 has a density >930 kg m-3 while 154 634 has a density >1320 kg m-3.
3. Thermal observations
3.1. Data reduction and analysis
Asteroid 7343 was observed at the European Southern Observatory Very Large Telescope Unit 3 Melipal (ESO VLT UT3) at Paranal, Chile on 20.2 Jan. 2011 UTC using the VISIR mid-IR instrument in imaging mode (Lagage et al. 2004).
The VISIR intermediate field was used, which has a pixel scale of 0.127 arcsec per pixel and a total field-of-view of 32.5 × 32.5 arcsec. The telescope was tracked at the mean rates of motion of the asteroid during the integration. The observations were perpendicular chop-nodded with a throw of 8 arcsec. The filters used are listed in Table 3.
The standard stars HD 26967 and HD 41047 were selected from Cohen et al. (1999). They were observed at three different airmasses covering a similar range to the asteroid (1.1–1.5) and within around 2h RA. An atmospheric extinction correction (<5%) and aperture correction (10–12%) was applied based on the calibration obtained. The typical FWHM and estimated uncertainties are given in Table 3.
Every observation consists of a sequence of nod pairs which were combined onto a single frame using the VISIR pipeline, which removes stripes caused by detector instabilities (Pantin et al. 2008). The observations were reduced with 3, 5, 7 and 10 pixel apertures in the same manner as described by Wolters et al. (2011). Comparison of the calibrated fluxes measured in each aperture radius showed they were consistent. The 5 pixel aperture was selected as it gave the highest S/N after incorporating the uncertainty contributions from photon statistics, extinction correction and aperture correction combined in quadrature. The observational circumstances and reduced fluxes are given in Table 4 and Fig. 4.
Reduced mid-IR VISIR fluxes.
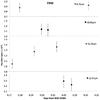 |
Fig. 4 Thermal-IR fluxes of asteroid 7343, corrected to mid-observation time and light-time corrected. 11.52 μm observations were interspersed with the other filters to detect a partial thermal-IR lightcurve, likely primarily caused by a changing projected area. It can be seen from the 11.52 μm fluxes that there is an increase in brightness between ≈0.17 and ≈0.22 days. A lightcurve correction of the fluxes was performed by subtracting the difference between a linear interpolation between the 11.52 μm fluxes and the mean 11.52 μm flux. The 12.47 μm fluxes were assumed to be at the same brightness as the last 11.52 μm observation, and the second 8.70 μm observation is removed from the lightcurve-corrected dataset as it was taken too long after the 11.52 μm fluxes to be corrected in this manner. |
3.2. Thermal modelling
By measuring both the scattered sunlight at an asteroid’s surface and the absorbed and re-emitted thermal IR flux, a unique albedo and diameter can be derived. An asteroid’s effective diameter (the equivalent diameter of a sphere with the same projected area as the – generally – irregularly shaped asteroid) can be related to its absolute visual magnitude HV and geometric albedo pV by (e.g. Fowler & Chillemi 1992):  (3)However the total radiation emitted in all directions cannot be directly measured. Instead a thermal model is used to simulate a surface temperature distribution. The Planck function is numerically integrated over the visible hemisphere to provide a model IR flux that can be best-fit to the observed fluxes. Three simple thermal models were used: the Near-Earth Asteroid Thermal Model (NEATM, Harris 1998), the Standard Thermal Model (STM, Lebofsky et al. 1986) and the Fast Rotating Model (FRM, Lebofsky & Spencer 1989). In the NEATM, the maximum temperature (Tmax) is given by:
 ![Mathematical equation: \begin{equation} T_{\rm max} = \left[\frac{\left(1-A\right)S}{\eta\epsilon\sigma}\right]^{\frac{1}{4}} \end{equation}](/articles/aa/full_html/2012/03/aa18302-11/aa18302-11-eq47.png) (4)
(4)
where A is the bolometric Bond albedo, S is the incident solar flux, η is the so-called beaming parameter, ϵ is the thermal IR emissivity (0.9 is assumed) and σ is the Stefan-Boltzmann constant. NEATM models the asteroid as a sphere and calculates the temperature on the surface assuming Lambertian emission on the day side and zero emission on the night side. These model assumptions increase the uncertainty to order 15% in diameter and 30% in albedo, based on comparisons with diameters of NEAs measured by radar (Harris 1998; Wolters & Green 2009). The NEATM allows η to be varied until the model flux gives a best fit to the observed thermal IR spectrum, effectively forcing the model temperature distribution to be consistent with the apparent colour temperature implied by the data. The STM describes an end case where the asteroid surface is in instantaneous equilibrium with the solar radiation, such as would be expected for a slow rotator with low surface thermal inertia, while the FRM assumes an iso-latitudinal temperature distribution suitable for a fast rotating high thermal inertia surface.
Thermal model derivations of albedo and diameter for asteroid (7343) Ockeghem.
Fits to these simple thermal models can be used to delineate a range of plausible surfaces. The absolute magnitude derived in Sect. 2.2, HV = 14.30 ± 0.08 was used. The thermal model fits to both the corrected and uncorrected fluxes are shown in Fig. 5 and the results are given in Table 5. The NEATM fit to the corrected fluxes was adopted as the nominal solution.
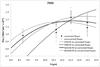 |
Fig. 5 STM, FRM and NEATM fits to lightcurve corrected thermal IR fluxes and NEATM fit to uncorrected fluxes. For clarity the error bars are not shown for the uncorrected fluxes. The STM and FRM fits to the uncorrected fluxes are almost indistinguishable from the fits to the corrected fluxes. |
3.3. Estimation of the Yarkovsky drift
Using the mathematical formulation of the diurnal Yarkovsky effect model given by Vokrouhlický et al. (2000) and Farinella et al. (1998), we estimate the Yarkovsky drift  for 7343, assuming cosγ = + 1 (where γ is the obliquity of the spin axis) and zero eccentricity. The maximum and minimum possible diameter and albedo are obtained from the corrected NEATM fit given in Table 5, and the rotation period assumed is Prot = 3.75 h (Pravec et al. 2010). We also required a reasonable asteroidal density range. We assume the surface density is equal to the bulk density. The density lower limit used for each asteroid was that determined in Sect. 2.2. Baer et al. (2011) lists all measured bulk densities for asteroids to date while Britt & Consolmagno (2004) lists those of ordinary chondrites, analogues to the S-types. By considering only those asteroids below 10 km diameter, and excluding known C-types (which are known to have a lower typical density), we are left with six values (Table 6). The asteroid mean bulk density is 2130 kg m-3 with a standard deviation 490 kg m-3, thus defining a nominal limit to the density. The average bulk density of the meteorites is 3320 kg m-3 with a standard deviation of 80 kg m-3, providing an absolute upper limit.
The maximum possible value of the drift for asteroid 7343 is  AU/Myr (36 m/yr) at a thermal inertia of ≈ 60 J m-2 s−1/2 K-1. As we do not know the obliquity, cosγ could range from –1 to +1, hence the possible Yarkovsky drift range for 7343 is (–2.4 to +2.4) × 10-4 AU/Myr. The drift rate given by the Farinella model was the same. For asteroid 154 634, assuming it has the same albedo as 7343 given that the spectra matched, and applying HV = 17.19 ± 0.16, we derive
  km. The possible Yarkovsky semi-major axis drift range for asteroid 154 634 is (–6.4 to +6.4) × 10-4 AU/Myr (96 m/yr). The drift rate calculated using the Farinella model was ± 6.3 × 10⁻⁴ AU/Myr. The distribution of with thermal inertia for each of the asteroids are given in Figs. 6 and 7.
Bulk densities of asteroids below 10 km diameter, excluding known C-types (Baer et al. 2011) and also ordinary chondrites that are analogues for S-types (Britt & Consolmagno 2004).
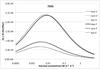 |
Fig. 6 Estimates of the maximum diurnal Yarkovsky drift for asteroid 7343, which assumes zero obliquity. Maximum drift (solid line) is calculated for minimum diameter, maximum albedo, minimum density. Nominal drift (dashed line) is calculated for nominal diameter, albedo and density. Minimum drift (dotted line) is calculated for maximum diameter, minimum albedo, and maximum density measured for asteroids. The Vokrouhlický et al. (2000) model is plotted as the darker line while the drift rate from Farinella et al. (1998) is plotted using the lighter line. |
4. Dynamical simulations
The “age” of pairs or groups of asteroids thought to be gravitationally bound to each other at some time in the past is measured from that time when components of the system decouple and become independent objects orbiting the Sun. In previous works (Vokrouhlický & Nesvorný 2008; Pravec et al. 2010), ages were constrained by investigating the convergence, both orbital and spatial, between pairs of large numbers of clones of the asteroids spanning their ephemeris uncertainty as well as the uncertainty in those physical parameters which directly affect the strength of the Yarkovsky acceleration.
Pravec & Vokrouhlický (2009) investigated the case examined here and found that, although the pair is probably genetically related, computation of proper elements used in comparing the nominal orbits of 7343 and 154 634 was corrupted by irregular jumps over a weak mean motion resonance and interaction with the z2 secular resonance = 2(g − g6) + s − s6 (Milani & Knez˘ević 1994). The distance between the two orbits in proper element space was found to be ~20 m s-1 in that work. They found this case to share some common characteristics with that of 56 232/115 978, discussed more extensively in their work, a pair with semimajor axis and inclination very similar to that of 7343/154 634. Hence, the following analysis potentially applies to that pair as well.
Pravec et al. (2010) investigated asteroid pairs under the assumption that they resulted from the past rotational fission of a binary system. They integrated the motion of several million clones for each pair and up to 1 Myr in the past (5 Myr for some cases) taking into account the action of the Yarkovsky effect and searching for mutual approaches of within a Hill sphere and at a low relative velocity between the orbits (a few m s-1). As a result of this procedure, they placed a lower limit on the age of 7343–154 634 of 800 kyr.
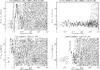 |
Fig. 8 Libration of the asteroid clones around the 2-1-1 zero order three-body mean motion resonance between the asteroid, Jupiter and Mars. Top left and bottom left plots are for 7343 while the plots on the right refer to 154 634. The top plots (from Batch 2) use the lower limit for the density in each case and a thermal conductivity of 4 × 10⁻³ while the bottom plots (Batch 1) use density 2130 kg m-3 and thermal conductivity of 2.5 × 10⁻³. The critical angle for both asteroids, as represented by their clones, currently librates around φ = −90° (i.e. at t = 0). LoD (see text) occurs between 1 and 4 × 10⁵ years for 7343 whilst 154 634 survives within the resonance until some time between 4 and 8 × 10⁵ years. |
Since our goal is also to constrain the age of 7343–154 634, our approach has been similar – although not entirely identical – to that used by other authors (Vokrouhlický & Nesvorný 2008). First, the uncertainty ellipsoid corresponding to the asteroids’ nominal states at Julian Date 2 455 800.5 was populated with dynamical clones. The asteroids’ covariance matrices were retrieved from the AstDys online service. The initial orbital elements of each clone were generated by applying the linear transformation:  (5)to a numerically-generated 6-dimensional normally-distributed random variate x (Johnson & Wichern 2002). Here, P and Λ represent the orthogonal and diagonal matrices of the eigenvectors and eigenvalues of the asteroids’ covariance matrices. The latter were retrieved from the AstDys online service.
For the integrations we used the HYBRID scheme within the MERCURY package (Chambers 1999). This is based on a second-order variable symplectic (MVS) algorithm; it switches to a Bulirsch Stoer scheme within a user-specified distance from a massive object in order to accurately model close encounters. Although the asteroids’ orbits are not currently planet-crossing, we opted for this scheme in view of their perihelion distance being 0.2 AU from the aphelion distance of Mars’ orbit.
To model the Yarkovsky acceleration we utilised the user-defined force subroutine available in MERCURY. The specific model used was that by Farinella et al. (1998). Only the along-track acceleration due to the diurnal effect was included. The values of the model parameters adopted in this work are shown in Table 7.
Physical properties used in dynamical simulations.
Since the (unknown) rotation axis obliquities ζ and thermal conductivities K of the asteroids are responsible for the largest uncertainty in the magnitude of the Yarkovsky force, we decided to run separate batches of simulations with K = 2.5 × 10⁻³ + n W m-1 K-1 (n = 0,1,2,3) and ζ7343/154 634 = kπ/2 (k = 0,1,2). Here, smaller values of K imply the presence of a regolith layer.
A total of thirty six (3 × 3 × 4) grid points were generated. For each of those points, 51 clones of each asteroid (36 × 51 × 51 ~ 93 × 103 pairs in total) were integrated back in time for 1 Myr. The integration output was sampled with a time step of 10 yr. The maximum rate of change in the semimajor axis (~40 m/yr for 154 634 and ~15 m/yr for 7343) was achieved for the lowest value of the thermal conductivity. The effect of changing the rotation from prograde to retrograde is to change the sign of from positive to negative. We shall refer to these simulations as “Batch 1” herefter.
In addition, we carried out simulations (“Batch 2”) where the adopted values for the size and rotation period of 154 634 with those obtained directly from our observations and the densities were set to the threshold values. In addition, we adopted density values close to the threshold for rotational disruption of the asteroids. This was done in order to study the evolution of the system under the maximum Yarkovsky acceleration allowed for by the uncertainties. For this reason, the thermal conductivity was also set to 4.0 × 10⁻³ Wm-1 K-1, the value that maximises (~80 m/yr for 154 634 and ~ 30 m/yr for 7343) in our model. The total number of clones investigated in this batch was 3 × 3 × 51 × 51 = 23 × 103.
We began our analysis of the results by seeking to understand the dynamical context of the asteroids’ past evolution. We examined the orbital element time series of the clones in order to identify the mean motion resonance alluded to by Pravec and Vokrouhlicky. We found this to be the 2-1-1 zero order three-body mean motion resonance between the asteroid, Jupiter and Mars (Nesvorný & Morbidelli 1998a,b). The time history of the resonance for all clones shares some common characteristics. As well as discussing them below, we illustrate these in Fig. 8. All clones of the asteroids in both integration batches are trapped in this resonance at t = 0 (JD 2 455 800.5), the critical angle φ = 2λ − λMars − λJup librating around φ = −90°.
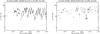 |
Fig. 9 Minimum relative velocity of clones within two integration batches – 2601 pairs per batch – for specific values of the thermal conductivities and obliquities (see text for details). This is approximately 10 m/s, consistent with models by Jacobson & Scheeres (2011). |
Before we discuss the individual cases of 7343 and 154 634, we note that the dynamical evolution of the clone clouds does not, in general, lose coherence (a process that we will hereafter refer to as loss of determinacy or LoD) and can be delayed for several 100 kyr after leaving the current libration regime (e.g. Fig. 8). This implies that further improvement of the ephemeris of these asteroids could be used to track its evolution farther back in time in a statistically valid way.
For the clones of 7343, the libration typically persists until (–1 to –1.5) × 105 yr into the past (left panels Fig. 8). Then, clones begin to leave this regime, either escaping from the resonance directly (i.e. φ begins to circulate) or switching to libration around a libration centre at φ = + 90° before eventually escaping.
For 154 634, the behaviour we observe depends on the magnitude of the Yarkovsky force. For Batch 1 (small ), escape occurs at (–3 to –4) × 105 yr while for Batch 2 (large ) escape occurs later, at (–7 to –8) × 105 yr. In the former case, LoD is also delayed beyond the point of leaving libration as it does for 7343, while for the latter case, can occur before leaving the resonance.
The progenitor system could either have been in or out of this resonance at the moment that the pair was created. If we assume that the velocity increment imparted was sufficiently mild so that both components remained in the same regime with respect to this resonance (an expected outcome of rotational fission), then these findings imply the following constraints on the age of this pair.
An age shorter than 1−1.5 × 10⁵ yr is possible but, as we will see shortly, not likely since both asteroids have been in the resonance for at least this long. From that point onward, and until t ~ −4 × 10⁵ yr, most of the clones of the asteroids within the pairs occupy different regimes (e.g. one is in the resonance and the other is not), so the likelihood that the age is in this range is low. For Batch 1 and for t < −4 × 10⁵ yr there exist many clones of both asteroids that are not in libration. In that sense, a lower bound for the age of the pair is 4 × 10⁵ yr. Following a similar argument for Batch 2 we obtain a lower bound of 8 × 10⁵ yr, consistent with the age reported by Pravec et al. (2010). Note that most clones of 154 634 are still in libration at the end of the integration (top right panel of Fig. 8).
In addition to the above we need to test whether a significant fraction of clone pairs converge, both in terms of orbital similarity as well as physical Eucleidian distance, at some specific point in the past. The results of Pravec & Vokrouhlický (2009) for pairs influenced by orbital resonances suggest that convergence is corrupted for 7343–154 634. Nevertheless, we found it instructive in evaluating the above-mentioned lower bounds for the age. In the case of orbital similarity we used the orbital similarity metric, δdv (Vokrouhlický & Nesvorný 2008) with the coefficient values used in Pravec & Vokrouhlický (2009). In Fig. 9 this is plotted for two grid points, one from Batch 1 (left panel) and the other from Batch 2 (right panel). To keep the plot from becoming congested and hindering interpretation, instead of plotting all data points we identified the time at which the distance of each pair of clones in the integration reaches a minimum, evaluated δdv for that time only and plotted this value versus time. Hence, the number of points plotted is 51 × 51 = 2601, one for every pair of integrated clones.
As Fig. 9 indicates, the δdv is generally in the range 10–50 m s-1 with some excursions down to 4 m s-1 at the approximate times of −4 × 10⁵, −5.5 × 10⁵, − 7.5 × 10⁵ and − 9 × 10⁵ yr. The epochs of these minima are about the same for different points in the parameter grid, leading us to conclude that they are robust features of the orbital evolution of this pair of asteroids. In the left panel (Batch 1), points are more evenly distributed in time for the earlier epochs while there is a near-absence of points in the most recent past (t > −2 × 10⁵ yr). A comparison between this panel and the upper two panels of Fig. 8 produced for the same rotation axis obliquities and thermal conductivities leads us to argue that the reason for the very low number of clone pairs achieving minimum δv in the immediate past is that LoD has not yet occurred. In other words, the asteroids’ orbits are statistically distinguishable and significantly different in the immediate past, rendering ages shorter than ~1.5 × 10⁵ yr implausible. For the case from Batch 2 (right panel of Fig. 9) we find that there is significant clumping of points, resulting in an apparently sparser plot. This is probably due to the persistence of 154 634 in libration while a scarcity of points for t < − 4 × 10⁵ yr correlates with circulation of the critical angle for many clones of 7343 (top left panel of Fig. 8).
For the test of approach distance we require, as in previous works, that clones approach to within one Hill radius of the system mass, 750 km, for the lower values of the density adopted in the integrations. As the sampling rate of 10 yr in our two integrated Batches is not high enough to reliably identify such close approaches – a mutual δv of 10 m s-1 would result in a distance travelled between the two asteroids in that period of time of 3 × 10⁶ km – we utilised the close approach monitoring feature of MERCURY to record any approach to within one Hill radius. One feature of the code is that only encounters between massive objects or between massive objects and massless particles can be recorded. We addressed this issue by giving the clones of 7343 a very small “token” mass (~10-35 of that of the Sun) in order to activate the encounter recording feature. Due to the larger number of computations that this increase in the number of massive objects entailed, we reduced the number of 7343 clones to 20 while those of 154 634 were kept to 51. Integrations were carried out for the following grid points: (1) K = 2.5e-1, ζ1 = 0, ζ2 = 90; (2) K = 2.5e0, ζ1 = 0, ζ2 = 180; (3) K = 4.0e-3, ζ1 = 0, ζ2 = 180; (4) K = 4.0e-3, ζ1 = 180, ζ2 = 0. The former two cases were among those investigated in Batch 1 whereas the latter two belong to Batch 2.
For the total of 4 × 10²⁰ pairs investigated, we found 4 instances where objects approached each other to within a Hill radius. All occurred in the two cases chosen from Batch 1, at t = −5.6 × 10⁵ yr, − 7.2 × 10⁵ yr, − 9.2 × 10⁵ yr (Case 1) and t = −7.0 × 10⁵ yr (Case 2; left panel of Fig. 9) and for cartesian velocities between 37 and 77 m s-1. Although the statistical significance of this result is arguable, it is consistent with
-
(a)
a separation epoch beyond the asteroids’ lifetime in theresonance;
-
(b)
the correlation between Yarkovsky effect magnitude and the postulated lower bound on the age; and
-
(c)
our rejection of a more recent age for this pair on orbital similarity grounds.
Hence, we conclude that the pair is older than ~4 × 10⁵ yr for “weak” Yarkovsky acceleration and ~8 × 10⁵ yr for “strong” Yarkovsky acceleration. The current difference in the longitude of nodes of the asteroids is ≈ 1 degree with a difference in precessional frequency of ≈6 × 10⁻³ arcsec yr-1 (given by AstDys). Assuming that the Yarkovsky force causes minimal change to precessional motion of the nodes, the time required to bring the nodes to convergence is thus 600 kyrs, consistent with the timescales found in this study. A more definite answer depends on whether LoD is primarily due to the inherent chaoticity of the orbits or the current level of uncertainty in the knowledge of their orbits and physical parameters. If the latter is true, improvement of the asteroids’ ephemeris as well as order of magnitude determination of the thermal conductivity of their surfaces will allow stronger constraints to be placed on the age.
5. Conclusions
We have conducted optical spectroscopy of asteroids 7343 and 154 634. We find that the spectra of both asteroids are extremely similar, suggesting a common composition. We have assigned both asteroids an S-type taxonomy. The densities may be between 930 and 2130 kg m-3, corresponding to lower limits from light curve analysis and the expected bulk density of silicates respectively. This range encompasses the low densities and high porosities expected if these objects result from YORP-induced spin and fission.
Using thermal IR observations we have measured the size of asteroid 7343 to be 4.11 ± 0.62 km across and its geometric albedo to be 0.20 ± 0.06, consistent with an S-type taxonomy. Given the similarity of the spectra of both asteroids we assume that the albedo of both asteroids are the same, and have estimated the diameter of 154 634 to be 1.09  km given its measured absolute magnitude. Using the density limits and the measured sizes of both asteroids, assuming ellipsoidal asteroids with semi-axes ratios given by Eq. (2), we estimate a mass ratio range for these asteroids to be 0.007 to 0.065 assuming that they have equal or comparable densities. This value is well within the limit for the secondary asteroid to have a positive free energy, and therefore have the capability to decouple from the mutual orbit.
We have also conducted new dynamical simulations of the orbits of both asteroids using the new physical characteristics measured during this study. We find that the orbital history of both asteroids is complicated given that both are currently trapped in a three-body mean motion resonance with Mars and Jupiter. The magnitude of the Yarkovsky force is thus critically important in determining the formation age of this unbound pair of asteroids. We propose an absolute lower limit on the age of this pair to be 400 kyr but a more likely lower limit is 560 kyr, lower than previously thought (800 kyr). However, we note that an improvement in the ephemeris of both asteroids and a determination of the thermal conductivity of their surfaces would significantly improve the dynamical solutions and thus further constrain the formation time of this pair.
The physical properties of the asteroids and the dynamical study point to the asteroids having formed from a single parent body, consistent with rotational fission. The similarity in surface composition suggests a common origin. If both asteroids have been formed from the rotational fission of a common parent, we might well expect them to be highly fractured, porous bodies since the primary had to be a rubble pile to begin with in order to spin off the material to make the secondary, while the secondary may have formed from the loose agglomeration of material in orbit about the primary. While we note that formation from catastrophic collision could also potentially create objects with similar bulk properties, we deem this to be an unlikely formation mechanism given the low encounter velocities (few m s-1) from the dynamical simulations.
We can also tentatively place a new timescale on space weathering. The S-types are believed to represent silicate-dominated asteroids which have undergone the process of space-weathering. The bombardment of the asteroid by micro-meteorites and solar ions has the effect of reddening the spectrum and reducing the depth of the silicate absorption bands (Loeffler et al. 2009). This is believed to be a rapid process, with weathering occurring on timescales shorter than 1 Myr (Vernazza et al. 2009). Our observations of a weathered spectrum amongst asteroids with an age range of 400–800 kyr is consistent with previous estimates of the timescales involved for space weathering.
Acknowledgments
Based on observations made with ESO telescopes at the La Silla and Paranal Observatories under programme ID 185.C-1033 and 185.1034. Observations were also obtained at the Palomar Observatory 200′′ Hale Telescope, operated by the California Institute of Technology. We acknowledge the financial support of the UK Science and Technology Facilities Council. A part of this work was supported by the NASA Planetary Astronomy Program and was performed at the Jet Propulsion Laboratory under contract with NASA. S.C.L. acknowledges support from SEPNet. The authors would like to thank David Vokrouhlický for his useful and insightful comments supplied during the review process. This helped improve the final version of this paper. IRAF is distributed by the National Optical Astronomy Observatories, which is operated by the Association of Universities for Research in Astronomy, Inc. (AURA) under cooperative agreement with the National Science Foundation. We acknowledge JPLs Horizons online ephemeris generator for providing the asteroids position and rate of motion during the observations.
References
- Allen, C. W. 1973, Astrophysical Quantities (London: University of London) [Google Scholar]
- Baer, J., Chesley, S. R., & Matson, R. D. 2011, AJ, 141, 143 [NASA ADS] [CrossRef] [Google Scholar]
- Bowell, E., Hapke, B., Domingue, D., et al. 1989, in Asteroids II, ed. R. P. Binzel, T. Gehrels, & M. S. Matthews, 524 [Google Scholar]
- Britt, D. T., & Consolmagno, G. J. 2004, in Lunar and Planetary Institute Science Conference Abstracts, ed. S. Mackwell, & E. Stansbery, 35, 2108 [Google Scholar]
- Bus, S. J., Vilas, F., & Barucci, M. A. 2002, Asteroids III, 169 [Google Scholar]
- Chambers, J. E. 1999, MNRAS, 304, 793 [NASA ADS] [CrossRef] [MathSciNet] [Google Scholar]
- Cohen, M., Walker, R. G., Carter, B., et al. 1999, AJ, 117, 1864 [NASA ADS] [CrossRef] [Google Scholar]
- DeMeo, F. E., Binzel, R. P., Slivan, S. M., & Bus, S. J. 2009, Icarus, 202, 160 [NASA ADS] [CrossRef] [Google Scholar]
- Ďurech, J., Vokrouhlický, D., & Kaasalainen, M. 2008, A&A, 489, L25 [NASA ADS] [CrossRef] [EDP Sciences] [Google Scholar]
- Farinella, P., Vokrouhlický, D., & Hartmann, W. K. 1998, Icarus, 132, 378 [NASA ADS] [CrossRef] [Google Scholar]
- Fowler, J. W., & Chillemi, J. R. 1992, in The IRAS Minor Planet Survey, Hanscom AF Base, MA, 17 [Google Scholar]
- Harris, A. W. 1998, Icarus, 131, 291 [NASA ADS] [CrossRef] [EDP Sciences] [Google Scholar]
- Horne, K. 1986, ASP, 98, 609 [NASA ADS] [CrossRef] [Google Scholar]
- Jacobson, S. A., & Scheeres, D. J. 2011, Icarus, 214, 161 [NASA ADS] [CrossRef] [Google Scholar]
- Johnson, R. A., & Wichern, D. W. 2002, Applied Multivariate Statistical Analysis (New Jersey: Prentice Hall), 767 [Google Scholar]
- Kaasalainen, M., Ďurech, J., Warner, B. D., Krugly, Y. N., & Gaftonyuk, N. M. 2007, Nature, 446, 420 [NASA ADS] [CrossRef] [PubMed] [Google Scholar]
- Lagage, P. O., Pel, J. W., Authier, M., et al. 2004, The Messenger, 117, 12 [NASA ADS] [Google Scholar]
- Lebofsky, L. A., & Spencer, J. R. 1989, in Asteroids II, Proc. Conf., 128 [Google Scholar]
- Lebofsky, L. A., Sykes, M. V., Tedesco, E. F., et al. 1986, Icarus, 68, 239 [NASA ADS] [CrossRef] [Google Scholar]
- Loeffler, M. J., Dukes, C. A., & Baragiola, R. A. 2009, J. Geophys. Res. (Planets), 114, E03003 [NASA ADS] [CrossRef] [Google Scholar]
- Lowry, S. C., Fitzsimmons, A., Pravec, P., et al. 2007, Science, 316, 272 [NASA ADS] [CrossRef] [PubMed] [Google Scholar]
- Luu, J. X., & Jewitt, D. C. 1992, AJ, 104, 2243 [NASA ADS] [CrossRef] [Google Scholar]
- Milani, A., & Knežević, Z. 1994, Icarus, 107, 219 [NASA ADS] [CrossRef] [Google Scholar]
- Mothé-Diniz, T., Carvano, J. M. Á., & Lazzaro, D. 2003, Icarus, 162, 10 [NASA ADS] [CrossRef] [Google Scholar]
- Nesvorný, D., & Morbidelli, A. 1998a, Celest. Mech. Dynam. Astron., 71, 243 [Google Scholar]
- Nesvorný, D., & Morbidelli, A. 1998b, AJ, 116, 3029 [NASA ADS] [CrossRef] [Google Scholar]
- Pantin, E., Vanzi, L., & Weilenmann, U. 2008, The 2007 ESO Instrument Calibration Workshop, Proc. ESO Workshop held in Garching, 119 [Google Scholar]
- Pravec, P., & Harris, A. W. 2000, Icarus, 148, 12 [NASA ADS] [CrossRef] [Google Scholar]
- Pravec, P., & Vokrouhlický, D. 2009, Icarus, 204, 580 [NASA ADS] [CrossRef] [Google Scholar]
- Pravec, P., Vokrouhlický, D., Polishook, D., et al. 2010, Nature, 466, 1085 [NASA ADS] [CrossRef] [Google Scholar]
- Rubincam, D. P. 2000, Icarus, 148, 2 [NASA ADS] [CrossRef] [Google Scholar]
- Scheeres, D. J. 2007, Icarus, 189, 370 [NASA ADS] [CrossRef] [Google Scholar]
- Scheeres, D. J. 2009, Celest. Mech. Dynam. Astron., 104, 103 [Google Scholar]
- Shevchenko, V. G., & Lupishko, D. F. 1998, Sol. Sys. Res., 32, 220 [Google Scholar]
- Taylor, P. A., Margot, J.-L., Vokrouhlický, D., et al. 2007, Science, 316, 274 [NASA ADS] [CrossRef] [PubMed] [Google Scholar]
- Vernazza, P., Binzel, R. P., Rossi, A., Fulchignoni, M., & Birlan, M. 2009, Nature, 458, 993 [NASA ADS] [CrossRef] [Google Scholar]
- Vokrouhlický, D., & Nesvorný, D. 2008, AJ, 136, 280 [NASA ADS] [CrossRef] [Google Scholar]
- Vokrouhlický, D., & Nesvorný, D. 2009, AJ, 137, 111 [NASA ADS] [CrossRef] [Google Scholar]
- Vokrouhlický, D., Milani, A., & Chesley, S. R. 2000, Icarus, 148, 118 [NASA ADS] [CrossRef] [Google Scholar]
- Vokrouhlický, D., Ďurech, J., Polishook, D., et al. 2011, AJ, 142, 159 [NASA ADS] [CrossRef] [Google Scholar]
- Walsh, K. J., Richardson, D. C., & Michel, P. 2008, Nature, 454, 188 [NASA ADS] [CrossRef] [Google Scholar]
- Warner, B. D., Harris, A. W., & Pravec, P. 2009, Icarus, 202, 134 [NASA ADS] [CrossRef] [Google Scholar]
- Wolters, S. D., & Green, S. F. 2009, MNRAS, 400, 204 [NASA ADS] [CrossRef] [Google Scholar]
- Wolters, S. D., Rozitis, B., Duddy, S. R., et al. 2011, MNRAS, 418, 1246 [NASA ADS] [CrossRef] [Google Scholar]
All Tables
Bulk densities of asteroids below 10 km diameter, excluding known C-types (Baer et al. 2011) and also ordinary chondrites that are analogues for S-types (Britt & Consolmagno 2004).
All Figures
|
Fig. 1 Comparison of spectra of 7343-154634. The spectra are remarkably similar. The S-type reflectances are overplotted to indicate the quality of the fit. |
| In the text | |
|
Fig. 2 Lightcurve Segment of asteroid (7343) Ockeghem. This segment is approximately one hour in length and is consistent with a rotation period between 3.5 and 4 h. |
| In the text | |
|
Fig. 3 Folded lightcurve of asteroid (154 634) 2003. XX38. The folded lightcurve period is 2.950 ± 0.015 h. |
| In the text | |
|
Fig. 4 Thermal-IR fluxes of asteroid 7343, corrected to mid-observation time and light-time corrected. 11.52 μm observations were interspersed with the other filters to detect a partial thermal-IR lightcurve, likely primarily caused by a changing projected area. It can be seen from the 11.52 μm fluxes that there is an increase in brightness between ≈0.17 and ≈0.22 days. A lightcurve correction of the fluxes was performed by subtracting the difference between a linear interpolation between the 11.52 μm fluxes and the mean 11.52 μm flux. The 12.47 μm fluxes were assumed to be at the same brightness as the last 11.52 μm observation, and the second 8.70 μm observation is removed from the lightcurve-corrected dataset as it was taken too long after the 11.52 μm fluxes to be corrected in this manner. |
| In the text | |
|
Fig. 5 STM, FRM and NEATM fits to lightcurve corrected thermal IR fluxes and NEATM fit to uncorrected fluxes. For clarity the error bars are not shown for the uncorrected fluxes. The STM and FRM fits to the uncorrected fluxes are almost indistinguishable from the fits to the corrected fluxes. |
| In the text | |
|
Fig. 6 Estimates of the maximum diurnal Yarkovsky drift for asteroid 7343, which assumes zero obliquity. Maximum drift (solid line) is calculated for minimum diameter, maximum albedo, minimum density. Nominal drift (dashed line) is calculated for nominal diameter, albedo and density. Minimum drift (dotted line) is calculated for maximum diameter, minimum albedo, and maximum density measured for asteroids. The Vokrouhlický et al. (2000) model is plotted as the darker line while the drift rate from Farinella et al. (1998) is plotted using the lighter line. |
| In the text | |
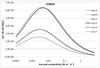 |
Fig. 7 As Fig. 6 but for asteroid 154 634. |
| In the text | |
|
Fig. 8 Libration of the asteroid clones around the 2-1-1 zero order three-body mean motion resonance between the asteroid, Jupiter and Mars. Top left and bottom left plots are for 7343 while the plots on the right refer to 154 634. The top plots (from Batch 2) use the lower limit for the density in each case and a thermal conductivity of 4 × 10⁻³ while the bottom plots (Batch 1) use density 2130 kg m-3 and thermal conductivity of 2.5 × 10⁻³. The critical angle for both asteroids, as represented by their clones, currently librates around φ = −90° (i.e. at t = 0). LoD (see text) occurs between 1 and 4 × 10⁵ years for 7343 whilst 154 634 survives within the resonance until some time between 4 and 8 × 10⁵ years. |
| In the text | |
|
Fig. 9 Minimum relative velocity of clones within two integration batches – 2601 pairs per batch – for specific values of the thermal conductivities and obliquities (see text for details). This is approximately 10 m/s, consistent with models by Jacobson & Scheeres (2011). |
| In the text | |
Current usage metrics show cumulative count of Article Views (full-text article views including HTML views, PDF and ePub downloads, according to the available data) and Abstracts Views on Vision4Press platform.
Data correspond to usage on the plateform after 2015. The current usage metrics is available 48-96 hours after online publication and is updated daily on week days.
Initial download of the metrics may take a while.