Fig. 2
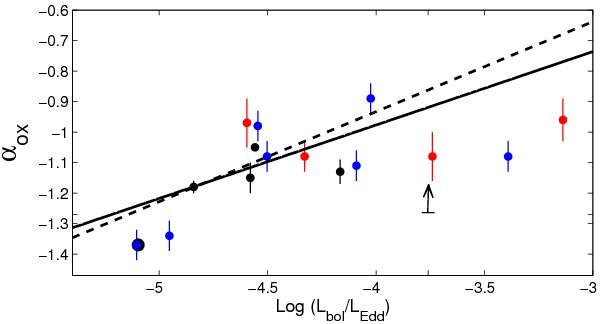
αox dependence on the Eddington ratio. The black-dashed line represents the best fit linear regression to our sample of LINER 1s (black dots) and the sample of Pian et al. (2010, red dots), both with αox values derived from simultaneous UV and X-ray fluxes. The black solid-line represents the best fit linear regression to all data, including the Maoz (2007, blue dots) sample. These latter values derive from non-simultaneous observations. The upper limit represents the value derived on NGC 3718 and is not included in the regression analysis. See text for more details.
Current usage metrics show cumulative count of Article Views (full-text article views including HTML views, PDF and ePub downloads, according to the available data) and Abstracts Views on Vision4Press platform.
Data correspond to usage on the plateform after 2015. The current usage metrics is available 48-96 hours after online publication and is updated daily on week days.
Initial download of the metrics may take a while.