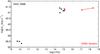
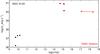
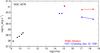
Fig. 1
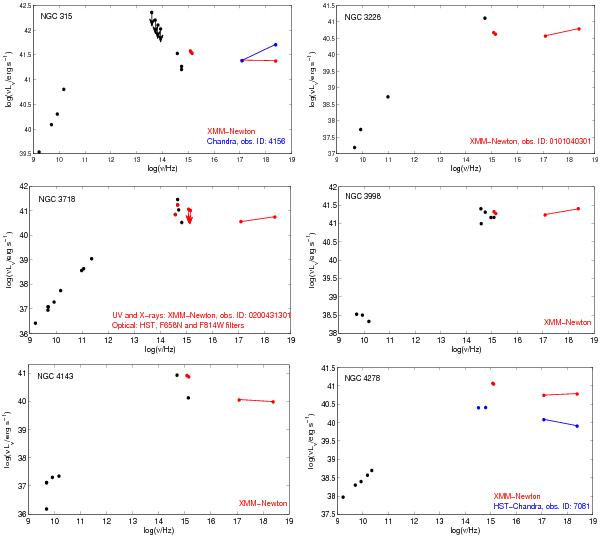
Top left panel. The NGC 315 SED. The red dots represent the simultaneous XMM-NewtonUVM2, UVW2, and X-ray luminosities. The blue dots represent the Chandra, obs. ID: 4156, soft and hard band luminosities. Notice the spectral and flux variability in the X-ray band (Paper I). Top right panel. The NGC 3226 SED. The red dots represent the simultaneous XMM-Newton UV and X-ray luminosities. Middle left panel. The NGC 3718 SED, which is one of the most complete SED of our sample with quasi-simultaneous HST-optical and XMM-Newton UV and X-ray fluxes (red dots). Middle right panel. The NGC 3998 SED with the red dots representing the simultaneous XMM-Newton UV and X-ray luminosities. Lower left panel. The NGC 4143 SED. The red dots represent the simultaneous XMM-Newton UV and X-ray fluxes. Note the high variability amplitude at UV wavelengths between the HST black-dot and the OM red-dots taken six years apart. This LINER 1 shows the highest UV flux relative to the X-ray in our sample. Lower right panel. The two NGC 4278 SEDs, representing the low state contemporary HST-optical and Chandra-X-ray fluxes (blue dots), and the high state simultaneous XMM-Newton UV and X-ray fluxes (red dots). See text for more details.
Current usage metrics show cumulative count of Article Views (full-text article views including HTML views, PDF and ePub downloads, according to the available data) and Abstracts Views on Vision4Press platform.
Data correspond to usage on the plateform after 2015. The current usage metrics is available 48-96 hours after online publication and is updated daily on week days.
Initial download of the metrics may take a while.