Fig. 9
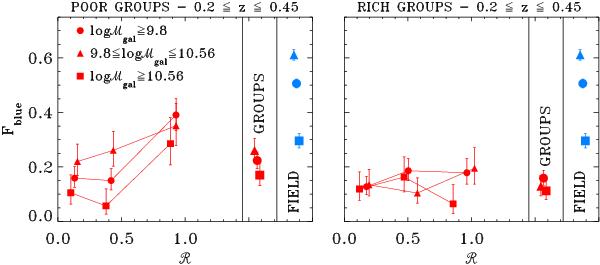
Corrected blue fraction as a function of the group-centric distance in the low-z poor groups (left) and rich groups (right). We define poor(rich) groups as those with number of member galaxies ≤ ( > )12 after applying the evolving magnitude cut off  (see Fig. 3). The mass bins adopted are indicated in the legend. Corrected blue fractions are displayed at the median of the distances from the center for galaxies in each region. As a reference we also plot the fraction of the blue field galaxies and the mean corrected blue fraction in groups.
Current usage metrics show cumulative count of Article Views (full-text article views including HTML views, PDF and ePub downloads, according to the available data) and Abstracts Views on Vision4Press platform.
Data correspond to usage on the plateform after 2015. The current usage metrics is available 48-96 hours after online publication and is updated daily on week days.
Initial download of the metrics may take a while.