Fig. 7
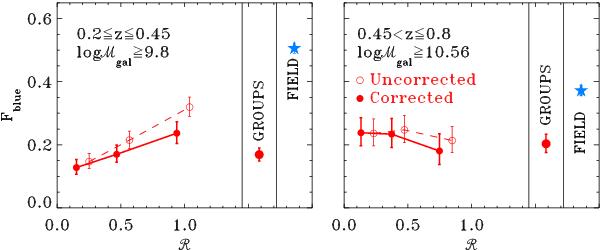
SG blue fraction as a function of the group-centric distance. Left/(right) panels refer to the low/(high) redshift bin and mass limits are ℳcut − off = 9.8/(ℳcut − off = 10.56). Open circles refer to observed Fblue while filled ones to corrected Fblue, i.e., taking into account interloper contamination (see text for details). The points refer to the three regions: inner core, intermediate, and more external/infall region. Corrected blue fractions values are displayed at the median distance of each region, while observed blue fractions are offset for clarity. As a reference we plot the fraction of the blue field galaxies (cyan star) and the mean corrected blue fraction in groups (big red circle).
Current usage metrics show cumulative count of Article Views (full-text article views including HTML views, PDF and ePub downloads, according to the available data) and Abstracts Views on Vision4Press platform.
Data correspond to usage on the plateform after 2015. The current usage metrics is available 48-96 hours after online publication and is updated daily on week days.
Initial download of the metrics may take a while.