Fig. 4
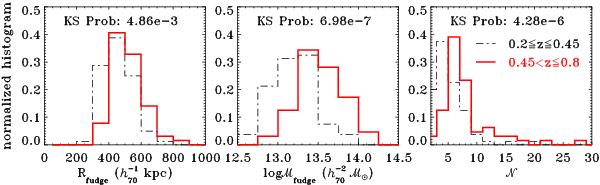
Comparison of the general properties of groups in the 0.2 ≤ z ≤ 0.45 (black dot-dashed line) and 0.45 < z ≤ 0.8 (red solid line) redshift bin. From left to right we compare Rfudge (the estimate of the virial radius), log ℳfudge (the estimate of the mass of the group), both fudge quantities are calibrated with the mocks as defined in Knobel et al. (2009), and  , as defined in Sect. 5.1.
Current usage metrics show cumulative count of Article Views (full-text article views including HTML views, PDF and ePub downloads, according to the available data) and Abstracts Views on Vision4Press platform.
Data correspond to usage on the plateform after 2015. The current usage metrics is available 48-96 hours after online publication and is updated daily on week days.
Initial download of the metrics may take a while.