Fig. 3
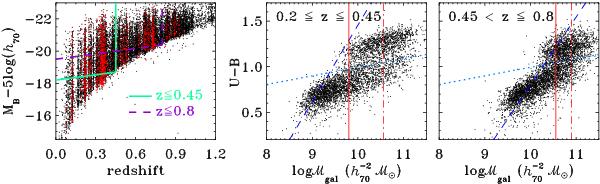
Left panel: redshift distribution of the zCOSMOS-bright galaxies (black). Red points represent group member galaxies with spectroscopic and photometric redshifts as obtained from our algorithm. The cyan solid line and the violet dashed line correspond to the two different magnitude cut-offs adopted to define the volume-limited samples of the low- and high-redshift bin respectively, see text for details. Central and right panel: (U − B) rest-frame color versus mass for the lowest and the highest redshift bin. The blue dashed line corresponds to the color-dependent ℳcut − off, while the red solid line corresponds to the fixed ℳcut − off for our mass volume-limited sample. The red dot-dashed lines highlight the mass ranges adopted in the mass-segregation analysis, see Sect. 6.5 for details. The cyan dotted line corresponds to the separation between red and blue galaxies (see text for its precise definition).
Current usage metrics show cumulative count of Article Views (full-text article views including HTML views, PDF and ePub downloads, according to the available data) and Abstracts Views on Vision4Press platform.
Data correspond to usage on the plateform after 2015. The current usage metrics is available 48-96 hours after online publication and is updated daily on week days.
Initial download of the metrics may take a while.