Fig. 2
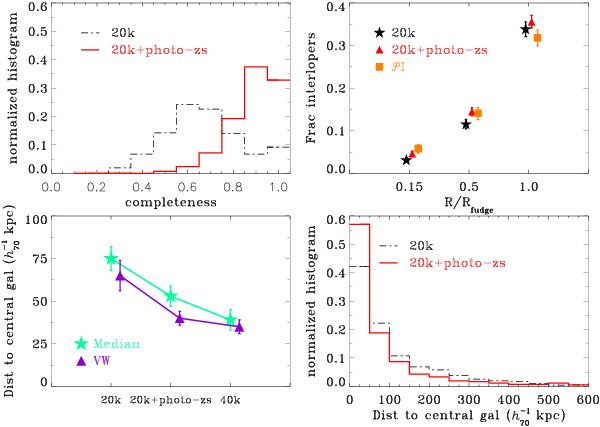
Summary of the results obtained with our algorithm. Top left: completeness distribution (see text for definition) for the 20K mocks (black dot-dashed line) and for the 20K+photo-zs mock groups (red solid line). Top right: fraction of interlopers as a function of normalized group-centric distance for the 20K/20K+photo-zs mock groups (black stars and red triangles, respectively). Orange squares refer to the fraction of interlopers,  , for real data, as calibrated on the mocks, see text for details. Bottom left: for different mocks as indicated on x-axis, the median distance to the central galaxy of the VW center (violet triangles) and the median center (cyan stars). Bottom right: distribution of the distance of the VW center to the central galaxy position for the 20K mocks (black dot-dashed line) and for the 20K+photo-zs mocks (red solid line).
Current usage metrics show cumulative count of Article Views (full-text article views including HTML views, PDF and ePub downloads, according to the available data) and Abstracts Views on Vision4Press platform.
Data correspond to usage on the plateform after 2015. The current usage metrics is available 48-96 hours after online publication and is updated daily on week days.
Initial download of the metrics may take a while.