Fig. 3
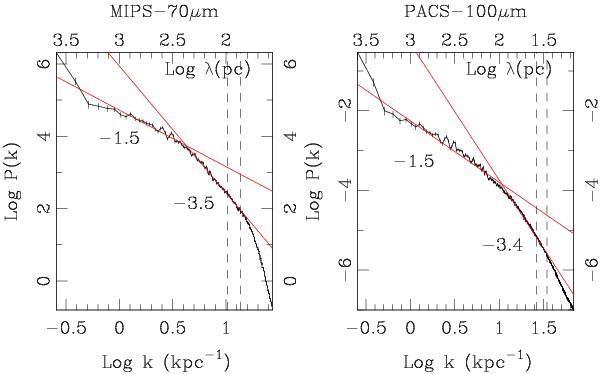
Power spectrum of the Spitzer-MIPS 70 μm map and the PACS-100 μm dust emission map of M 33. The vertical dashed line to the right represents the spatial resolution of the observations on the major axis. Since the deprojection to a face-on galaxy implies a factor 1 ! cos(56°) = 1.79 larger beam on the minor axis, we have also plotted a second dashed vertical line to the left, indicating the geometric mean of the resolution on both minor and major axes. Statistical error bars are given in this first figure, and then omitted later for clarity. They are significant only at the largest scales (small k), where the statistical errors are the largest. The red lines are power-law fits, minimizing the χ2, as explained in the text.
Current usage metrics show cumulative count of Article Views (full-text article views including HTML views, PDF and ePub downloads, according to the available data) and Abstracts Views on Vision4Press platform.
Data correspond to usage on the plateform after 2015. The current usage metrics is available 48-96 hours after online publication and is updated daily on week days.
Initial download of the metrics may take a while.