Fig. B.1
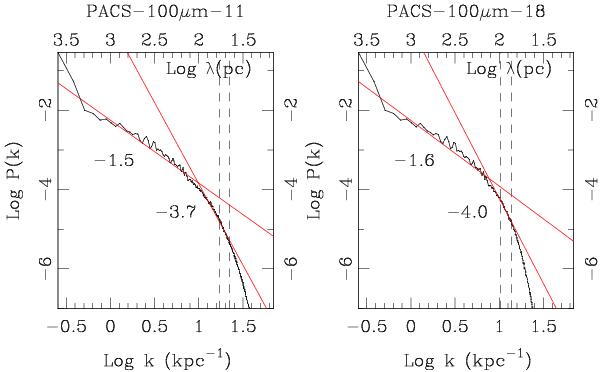
Power spectrum of the PACS 100 μm map, at degraded resolutions of 11 and 18′′. The vertical dashed line to the right represents the smoothed spatial resolution on the major axis. Since the deprojection to a face-on galaxy implies a factor 1 ! cos(56°) = 1.79 larger beam on the minor axis, we have also plotted a second dashed vertical line to the left, indicating the geometric mean of the resolution on both the minor and major axes.
Current usage metrics show cumulative count of Article Views (full-text article views including HTML views, PDF and ePub downloads, according to the available data) and Abstracts Views on Vision4Press platform.
Data correspond to usage on the plateform after 2015. The current usage metrics is available 48-96 hours after online publication and is updated daily on week days.
Initial download of the metrics may take a while.