Free Access
Fig. 1
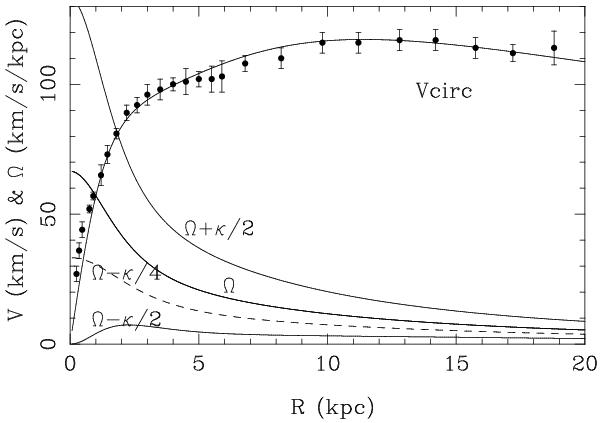
Rotation curve for our late-type Scd model, compared to the observed points (symbols and error bars) compiled for M 33 by Corbelli & Salucci (2007). In addition to the circular velocity of the model, the characteristic frequencies Ω, Ω − κ/2, etc. are plotted.
Current usage metrics show cumulative count of Article Views (full-text article views including HTML views, PDF and ePub downloads, according to the available data) and Abstracts Views on Vision4Press platform.
Data correspond to usage on the plateform after 2015. The current usage metrics is available 48-96 hours after online publication and is updated daily on week days.
Initial download of the metrics may take a while.