Fig. 6
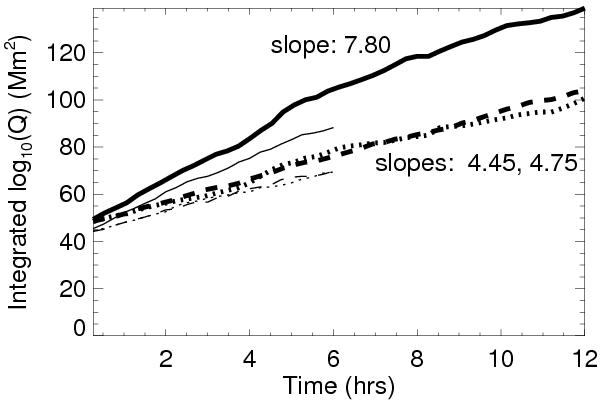
Integrated squashing factor,  as a function of time for the observed velocity field (thick lines) and analytical models of Sect. 4 (thin lines). The solid lines correspond to the observed v and combined model 3. Dotted and dashed lines correspond respectively to vdiv (or model 1) and vrot (or model 2). The given slopes are for a least-squares linear fit to the observed data.
Current usage metrics show cumulative count of Article Views (full-text article views including HTML views, PDF and ePub downloads, according to the available data) and Abstracts Views on Vision4Press platform.
Data correspond to usage on the plateform after 2015. The current usage metrics is available 48-96 hours after online publication and is updated daily on week days.
Initial download of the metrics may take a while.