Fig. 2
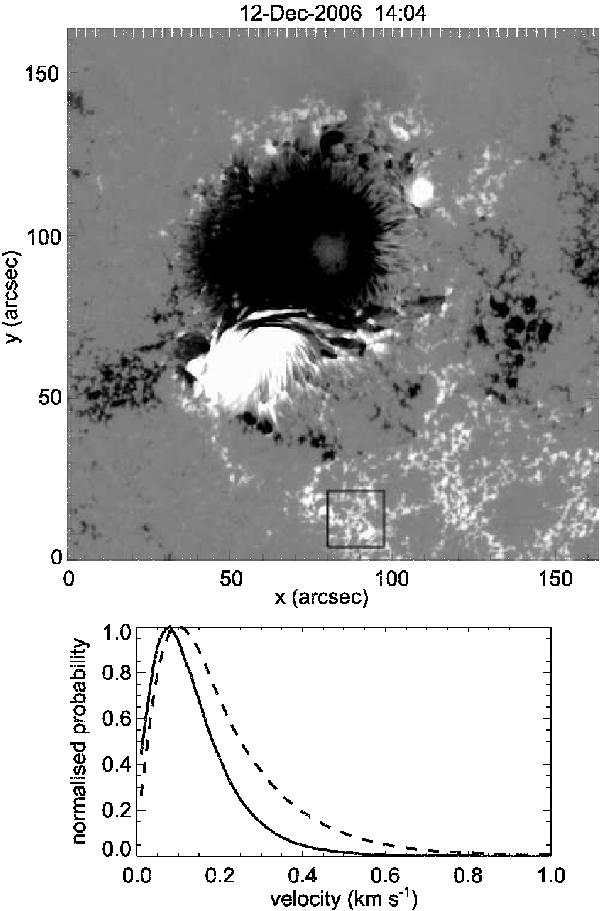
Top: location of the 12.4 Mm × 12.4 Mm analysis region (black box) in the full SOT line-of-sight magnetogram (1′′ = 725 km). Bottom: histogram of measured |v| in the analysis region, over the entire 12 h dataset. The solid line shows the filtered data, while the dashed line shows the original unfiltered data. Each curve is normalised by its own maximum.
Current usage metrics show cumulative count of Article Views (full-text article views including HTML views, PDF and ePub downloads, according to the available data) and Abstracts Views on Vision4Press platform.
Data correspond to usage on the plateform after 2015. The current usage metrics is available 48-96 hours after online publication and is updated daily on week days.
Initial download of the metrics may take a while.