Fig. 1
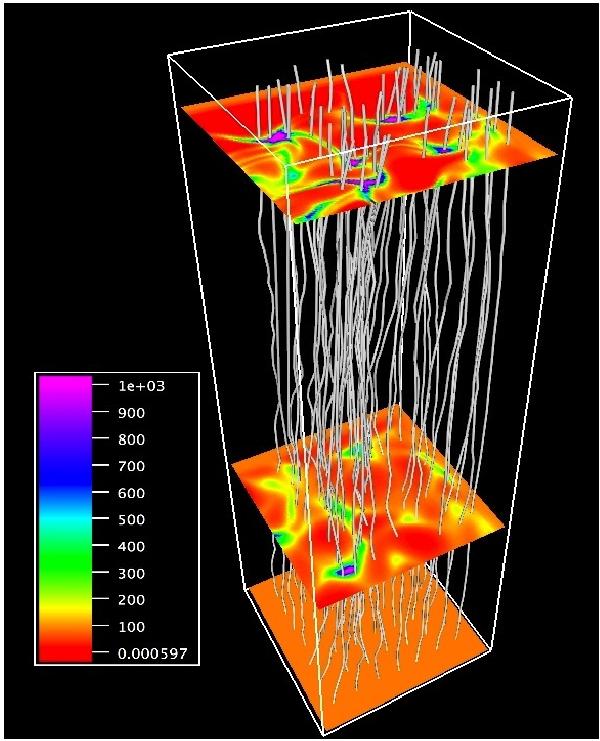
A hypothetical magnetic field (Appendix A) whose field line mapping matches that inferred from the observed velocity field. The magnetic field lines in this particular field are simply trajectories of tracer particles in the 2D, time-dependent velocity field (with time increasing vertically). Contour slices show Bz at different z with the colour scale in Gauss: the initial distribution (on the lower boundary) is a uniform field Bz(x,y,0) = 88 G, which was the average field strength in this region of the original SOT magnetogram.
Current usage metrics show cumulative count of Article Views (full-text article views including HTML views, PDF and ePub downloads, according to the available data) and Abstracts Views on Vision4Press platform.
Data correspond to usage on the plateform after 2015. The current usage metrics is available 48-96 hours after online publication and is updated daily on week days.
Initial download of the metrics may take a while.