Fig. 7
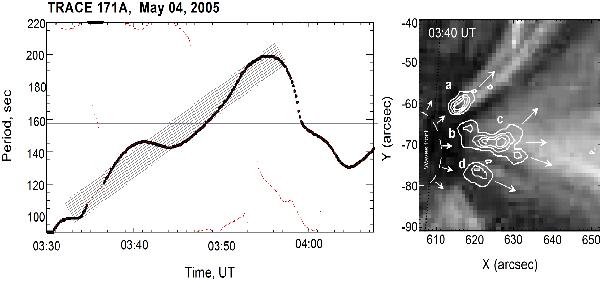
Left panel: wavelet skeleton of 3-min oscillations observed in the EUV emission over sunspot NOAA 10756 on May 04, 2005, at 03:30–04:08 UT. The negative trend of the frequency drift is shown by the mesh strip. Thick lines correspond to the global maxima of wavelet coefficients, and the thin lines to the local ones. Right panel: overlap of the narrowband image of 3-min EUV oscillation sources (shown by white contours) on the integral EUV image at 03:40 UT. The letters a, b, c and d correspond to the fine 3-min oscillation radio sources in Fig. 6 at 03:45 UT. The arrows indicate the apparent direction of the wave propagation.
Current usage metrics show cumulative count of Article Views (full-text article views including HTML views, PDF and ePub downloads, according to the available data) and Abstracts Views on Vision4Press platform.
Data correspond to usage on the plateform after 2015. The current usage metrics is available 48-96 hours after online publication and is updated daily on week days.
Initial download of the metrics may take a while.