Fig. 6
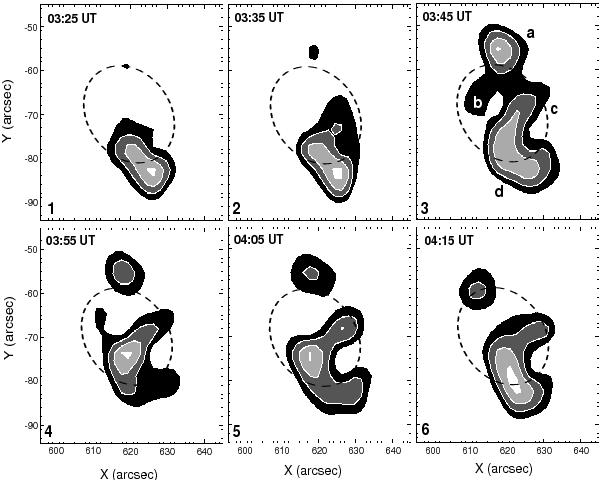
Time evolution of the spatial sources of 3-min oscillations of the microwave polarisation signal from sunspot NOAA 10756, obtained with NoRH at 17 GHz on May 04, 2005, during the 3-min frequency drift 03:20–04:30 UT. The grey colour scale shows the power of the oscillation. The dashed curve indicates the umbra-penumbra boundary. The integer numbers label the instants of time shown in Fig. 5. The letters label individual sources of the oscillations.
Current usage metrics show cumulative count of Article Views (full-text article views including HTML views, PDF and ePub downloads, according to the available data) and Abstracts Views on Vision4Press platform.
Data correspond to usage on the plateform after 2015. The current usage metrics is available 48-96 hours after online publication and is updated daily on week days.
Initial download of the metrics may take a while.