Free Access
Fig. 5
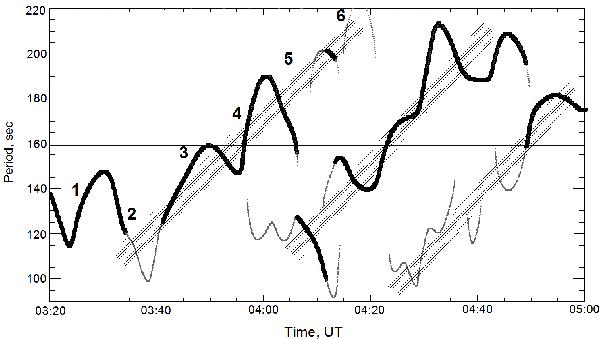
Wavelet skeleton of the NoRH correlation curve in the 90–220 s period band as a function of time, obtained at 17 GHz in the polarisation channel on May 04, 2005, 03:20–05:00 UT. The numbers indicate the times of the narrowband images shown in Fig. 6. The mesh strips indicate the prevailing trend of drifts.
Current usage metrics show cumulative count of Article Views (full-text article views including HTML views, PDF and ePub downloads, according to the available data) and Abstracts Views on Vision4Press platform.
Data correspond to usage on the plateform after 2015. The current usage metrics is available 48-96 hours after online publication and is updated daily on week days.
Initial download of the metrics may take a while.