Fig. 4
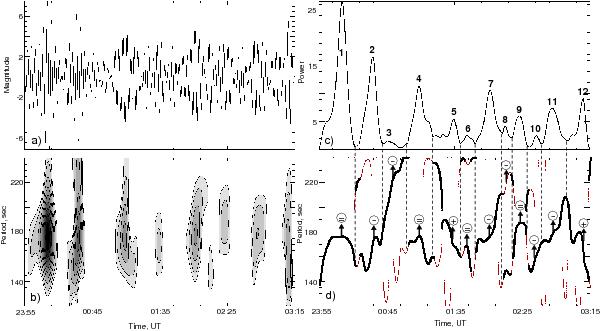
Wavelet analysis of the 3-min oscillation of the microwave signal on May 3, 2005, from 23:55 to 03:15 UT. Panel a) shows the amplitudes obtained by calculating the inverse wavelet transform of the signal in the 120–240 s period range. Panel b) power distribution of the 3-min oscillation trains in the wavelet spectrum. Panel c): time evolution of the 3-min oscillation power. The numbers show the numeration of the trains. Panel d) shows the wavelet skeleton representing both global (thick lines) and local (thin lines) extrema. In the circles we show the signs of the period drifts (positive, negative or without drift). Time is shown in UT, power and amplitudes are in arbitrary units.
Current usage metrics show cumulative count of Article Views (full-text article views including HTML views, PDF and ePub downloads, according to the available data) and Abstracts Views on Vision4Press platform.
Data correspond to usage on the plateform after 2015. The current usage metrics is available 48-96 hours after online publication and is updated daily on week days.
Initial download of the metrics may take a while.