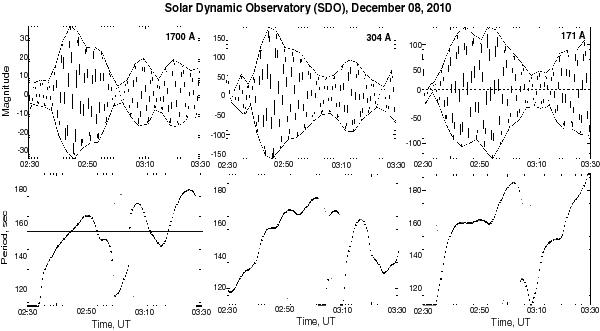
Fig. 10

Top panels: time profiles of 3-min oscillation trains in the emission intensity of the 1700, 304 and 171 Å signals obtained with SDO/AIA on December 8, 2010, at 2:30–03:30 UT. Envelopes of the trains are shown by the thick curves. Bottom panels: wavelet skeletons of the signals. The continuous line shows the period corresponding to the maximum spectral power.
Current usage metrics show cumulative count of Article Views (full-text article views including HTML views, PDF and ePub downloads, according to the available data) and Abstracts Views on Vision4Press platform.
Data correspond to usage on the plateform after 2015. The current usage metrics is available 48-96 hours after online publication and is updated daily on week days.
Initial download of the metrics may take a while.


