Fig. 4
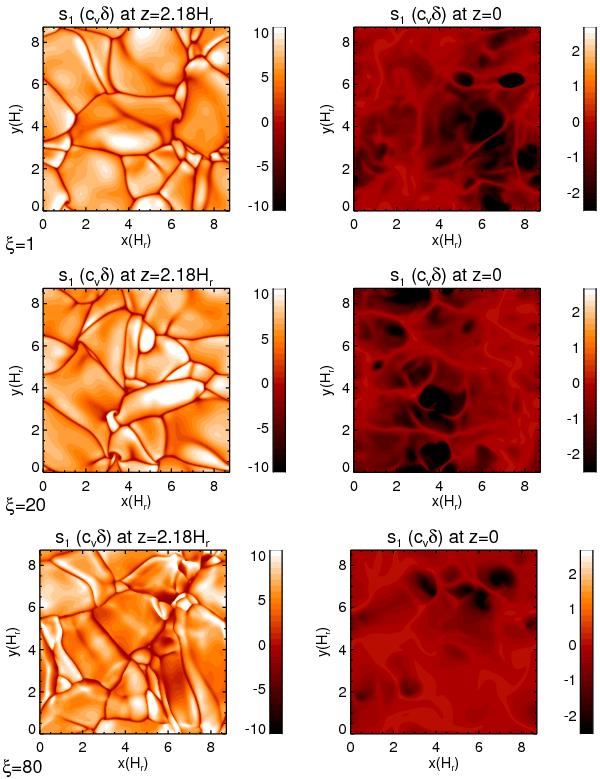
Snapshots of entropy of the 3D convection. Top, middle, and bottom panels correspond to ξ = 1, 10, and 80, respectively. Left (right) panels show entropy at top (bottom) boundary. (Animation is provided, and the difference between ξ = 1 and 80 is most clearly visible in the animation of Fig. 4, which is provided with the online version.)
Current usage metrics show cumulative count of Article Views (full-text article views including HTML views, PDF and ePub downloads, according to the available data) and Abstracts Views on Vision4Press platform.
Data correspond to usage on the plateform after 2015. The current usage metrics is available 48-96 hours after online publication and is updated daily on week days.
Initial download of the metrics may take a while.