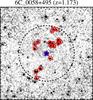
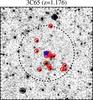
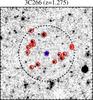
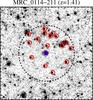
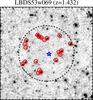
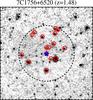
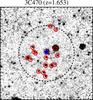
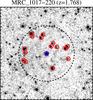
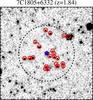
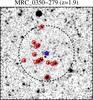
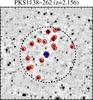
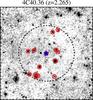
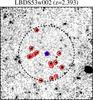
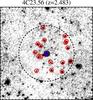
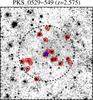
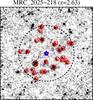
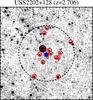
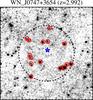
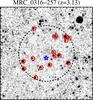
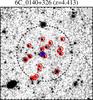
Fig. 7
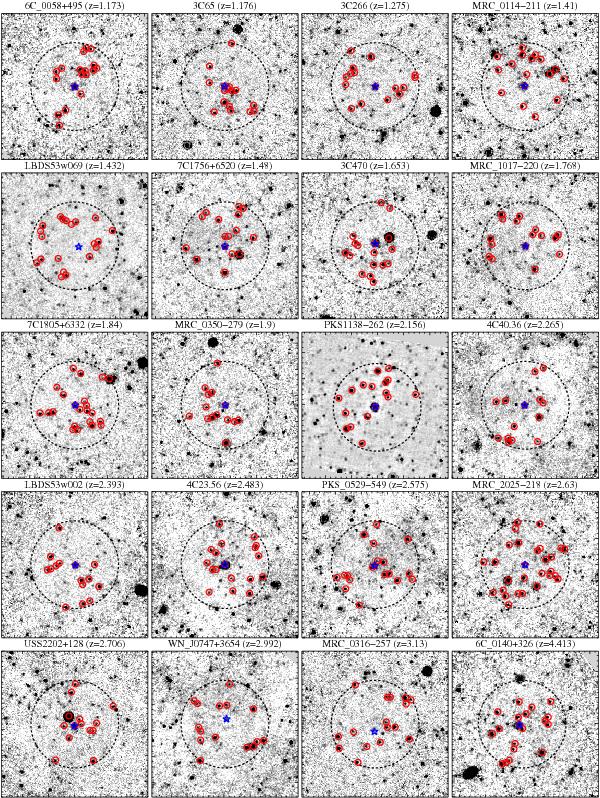
Cutouts of all HzRG 24 μm fields with a 3σ significance source overdensity. The dotted circle represents the 1.75′ radius circular sub-field that is analysed further, and plotted in red are the source for which f24 μm ≥ 0.3 mJy. All fields are scaled to the same 5.8′ × 5.8′ angular size, with North/East facing up/left. The HzRG is plotted as a blue star in each frame. Note that PKS1138-262 is much deeper GTO data. A colour counterpart is available in the online version of this article.
Current usage metrics show cumulative count of Article Views (full-text article views including HTML views, PDF and ePub downloads, according to the available data) and Abstracts Views on Vision4Press platform.
Data correspond to usage on the plateform after 2015. The current usage metrics is available 48-96 hours after online publication and is updated daily on week days.
Initial download of the metrics may take a while.