Free Access
Fig. 6
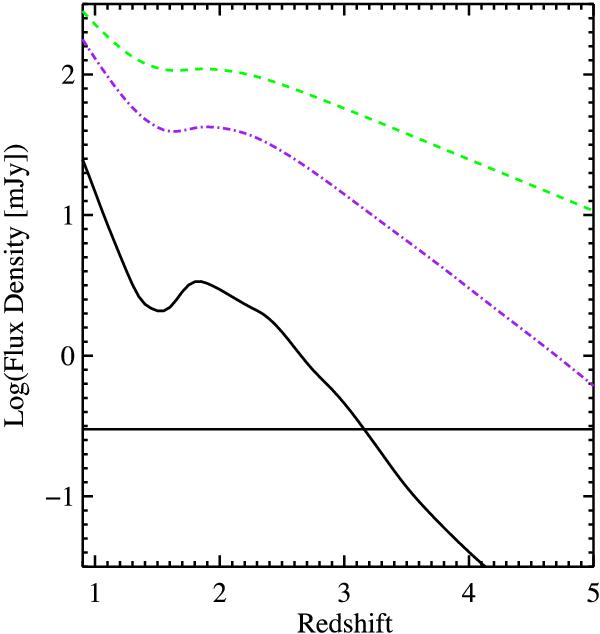
Observed MIPS 24 μm flux density versus redshift. Solid black line represents a starburst galaxy with a star formation rate of 1000 M⊙ yr-1. The dashed green line and dot-dash blue line represent a face-on and an edge-on quasar with L24 μm = 1045 erg s-1. The horizontal line represents the 0.3 mJy flux density cut.
Current usage metrics show cumulative count of Article Views (full-text article views including HTML views, PDF and ePub downloads, according to the available data) and Abstracts Views on Vision4Press platform.
Data correspond to usage on the plateform after 2015. The current usage metrics is available 48-96 hours after online publication and is updated daily on week days.
Initial download of the metrics may take a while.