Fig. 4
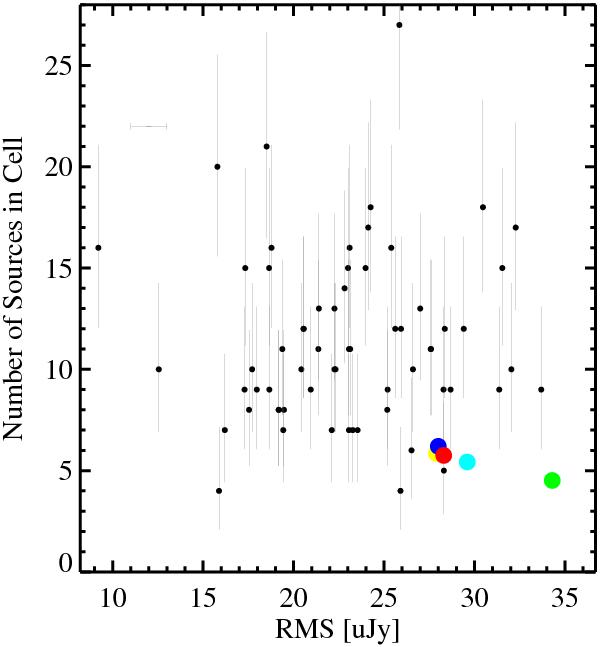
HzRG field density versus rms noise. No obvious correlation between the two values is found. The error bar plotted in the upper left in included to give an indication of a typical uncertainty in the rms values. SWIRE field values are plotted as larger circles where yellow, blue, red, green and cyan correspond to CDFS, EN1, EN2, XMM-LSS and Lockman fields respectively.
Current usage metrics show cumulative count of Article Views (full-text article views including HTML views, PDF and ePub downloads, according to the available data) and Abstracts Views on Vision4Press platform.
Data correspond to usage on the plateform after 2015. The current usage metrics is available 48-96 hours after online publication and is updated daily on week days.
Initial download of the metrics may take a while.