Fig. 2
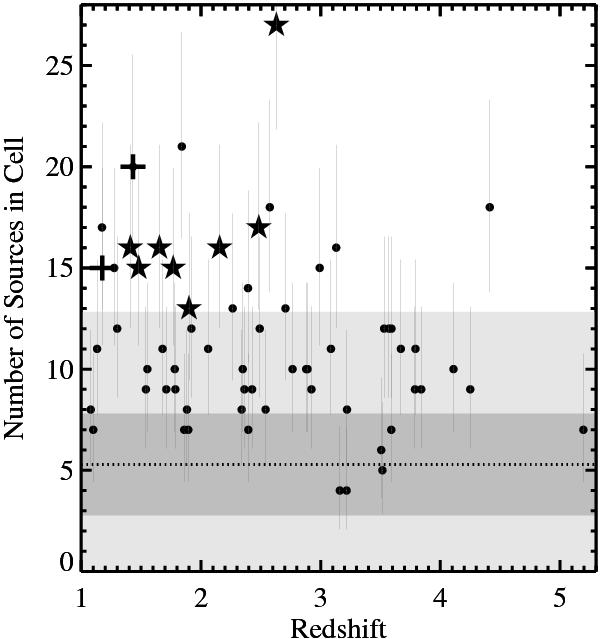
Source counts around each HzRG versus HzRG redshift. The dotted line indicates the SWIRE mean source count for a 1.75′ radius cell, the dark shaded region denotes ± 1σ and the light shaded region denotes ± 3σ on the SWIRE data. Starred symbols denote those sources which are considered candidate clusters in G12 (8) while the plus symboled sources (2) are those which are not studied in G12. Note that z > 3 sources are not deep enough to clarify protocluster candidacy in G12. The uncertainties on the source counts are derived from small number statistics.
Current usage metrics show cumulative count of Article Views (full-text article views including HTML views, PDF and ePub downloads, according to the available data) and Abstracts Views on Vision4Press platform.
Data correspond to usage on the plateform after 2015. The current usage metrics is available 48-96 hours after online publication and is updated daily on week days.
Initial download of the metrics may take a while.