Fig. 1
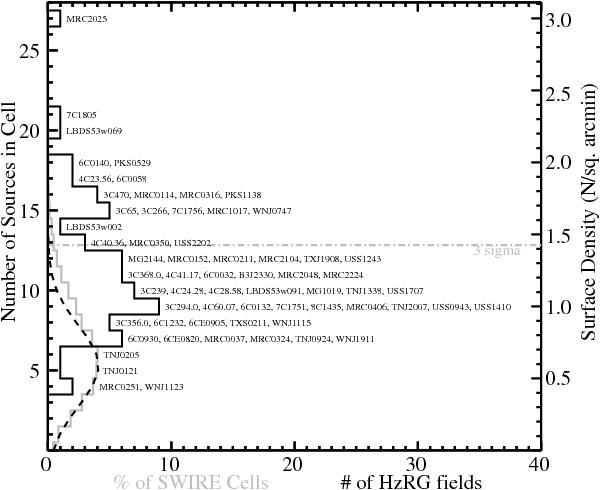
A comparison of HzRG source counts with the reference SWIRE fields. The distribution of the SWIRE 24 μm source counts in ~ 10 000 cirular cells of 1.75′ radius, representing five SWIRE fields, is plotted as a grey histogram. A Gaussian fit to the lower part of this distribution is overlayed as a dashed line. A 3σ above the SWIRE mean is indicated as a dot-dash line. A histogram of HzRG field densities is overlayed along with each HzRG name. The corresponding source number density is indicated on the right axis.
Current usage metrics show cumulative count of Article Views (full-text article views including HTML views, PDF and ePub downloads, according to the available data) and Abstracts Views on Vision4Press platform.
Data correspond to usage on the plateform after 2015. The current usage metrics is available 48-96 hours after online publication and is updated daily on week days.
Initial download of the metrics may take a while.