Fig. 6
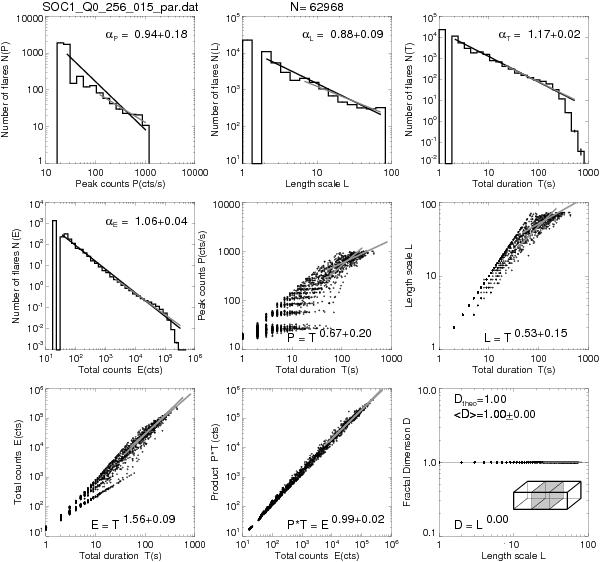
Cellular automaton simulations with a N = 256 1-D lattice produced by a numerical code according to Charbonneau et al. (2001). The frequency distributions of peak energy dissipation rate P, total energies E, time durations T, and fractal avalanche volumes V are shown along with the fitted powerlaw slopes. Correlations between the fractal dimension D1 and parameters E, P, and T are also shown, fitted in the ranges of P ≥ 50, E ≥ 50, T ≥ 5, and V ≥ 2. Only a representative subset of 2000 events are plotted in the scatterplots.
Current usage metrics show cumulative count of Article Views (full-text article views including HTML views, PDF and ePub downloads, according to the available data) and Abstracts Views on Vision4Press platform.
Data correspond to usage on the plateform after 2015. The current usage metrics is available 48-96 hours after online publication and is updated daily on week days.
Initial download of the metrics may take a while.