Fig. 3
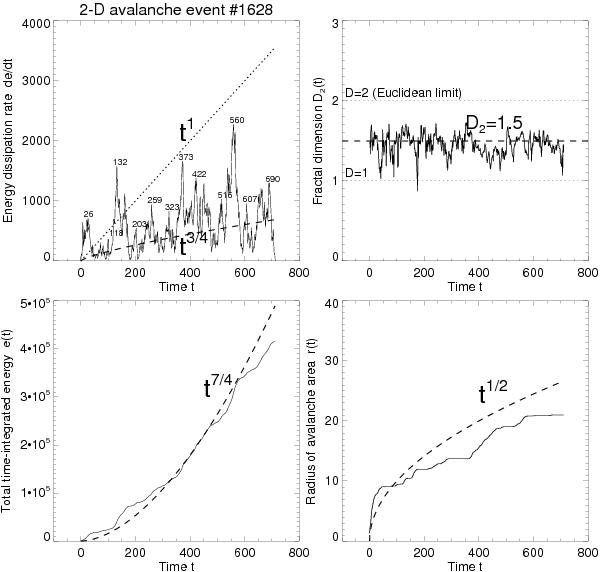
Time evolution of the largest avalanche event #1628 in the 2-D cellular automaton simulation with grid size N = 642. The time profiles include the instantaneous energy dissipation rate f(t) = de/dt (top left), the time-integrated total energy e(t) (bottom left), the instantaneous fractal dimension D2(t) (top right), and the radius of the avalanche area r(t) (bottom right). The observed time profiles from the simulations are outlined in solid linestyle and the theoretically predicted average evolution in dashed linestyle. The statistically predicted values of the instantaneous energy dissipation rate f(t) ∝ t3/4 (dotted curve) and peak energy dissipation rate p(t) ∝ t1 (dashed curve) after a time interval t are also shown (top left panel). The 12 time labels from 26 to 690 (top left frame) correspond to the snapshot times shown in Fig. 1.
Current usage metrics show cumulative count of Article Views (full-text article views including HTML views, PDF and ePub downloads, according to the available data) and Abstracts Views on Vision4Press platform.
Data correspond to usage on the plateform after 2015. The current usage metrics is available 48-96 hours after online publication and is updated daily on week days.
Initial download of the metrics may take a while.