Fig. 1
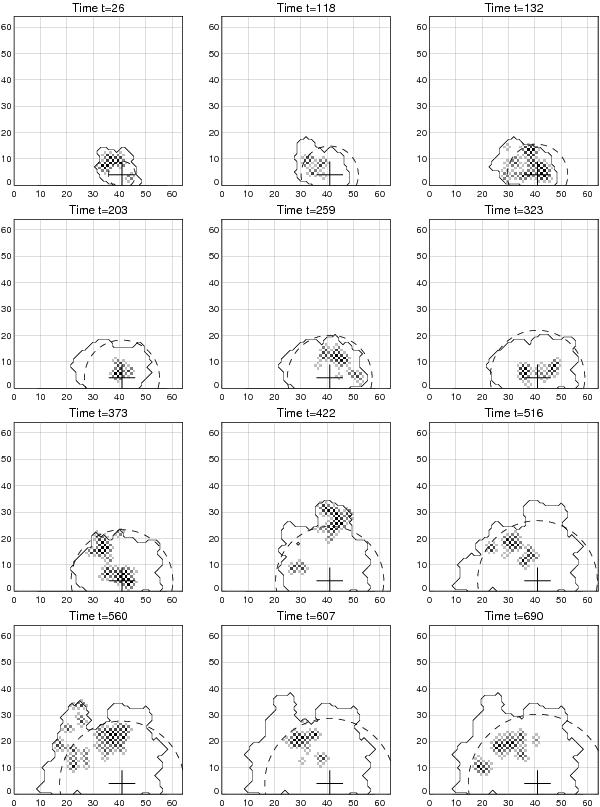
Time evolution of the largest avalanche event #1628 in the 2-D cellular automaton simulation with grid size N = 642. The 12 panels show snapshots at particular burst times from t = 26 to t = 690 when the energy dissipation rate peaked. Active nodes where energy dissipation occurs at time t are visualized with black and grey points, depending on the energy dissipation level. The starting point of the avalanche occurred at pixel (x,y) = (41,4), which is marked with a cross. The time-integrated envelop of the avalanche is indicated with a solid contour, and the diffusive avalanche radius r(t) = t1/2 is indicated with a dashed circle. The temporal evolution is shown in a movie available in the on-line version.
Current usage metrics show cumulative count of Article Views (full-text article views including HTML views, PDF and ePub downloads, according to the available data) and Abstracts Views on Vision4Press platform.
Data correspond to usage on the plateform after 2015. The current usage metrics is available 48-96 hours after online publication and is updated daily on week days.
Initial download of the metrics may take a while.