Fig. 4
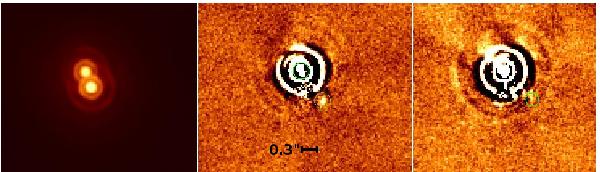
Left: final stacked false-colour image of GJ3305AB from 2009 December data, in L′. North is up and east is to the left. Logarithmic scale is used. Centre: residual image of GJ3305AB from 2009 December data, after GJ3305A is subtracted by simple ADI. GJ3305B and the candidate companion are highlighted with green circles. Linear scale is used. Right: residual image of GJ3305AB from 2011 September data, after GJ3305A is subtracted by simple ADI. No source is detected at the 2009 position of the 2009 source. The position expected for this source in case it was a background object is highlighted by a green circle. Linear scale is used. North is up and east to the left.
Current usage metrics show cumulative count of Article Views (full-text article views including HTML views, PDF and ePub downloads, according to the available data) and Abstracts Views on Vision4Press platform.
Data correspond to usage on the plateform after 2015. The current usage metrics is available 48-96 hours after online publication and is updated daily on week days.
Initial download of the metrics may take a while.