Fig. 2
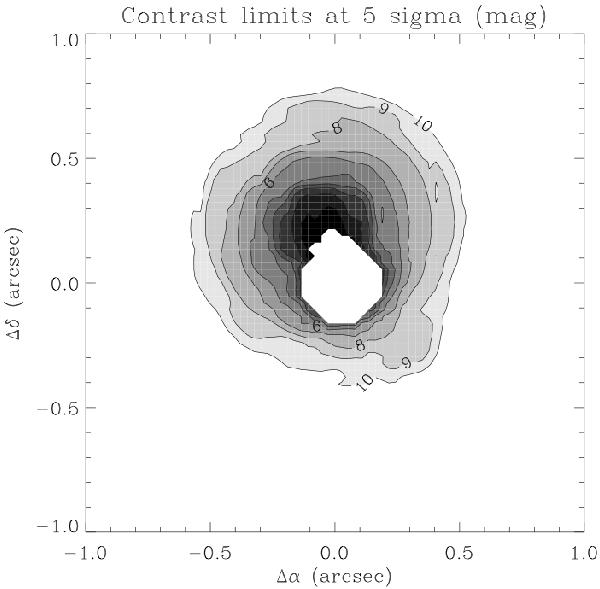
Final contrast map for the GJ3305AB system. Contours identify magnitudes of contrast at 5σ achieved at a given position. The white area in the centre shows the position of the primary where no contrast was measurable and the dark zone slightly on the north is the higher noise area induced by GJ3305B. North is up and east left.
Current usage metrics show cumulative count of Article Views (full-text article views including HTML views, PDF and ePub downloads, according to the available data) and Abstracts Views on Vision4Press platform.
Data correspond to usage on the plateform after 2015. The current usage metrics is available 48-96 hours after online publication and is updated daily on week days.
Initial download of the metrics may take a while.